
OpenAxis Data Journalist Intern | Graduate student at UCSD's School of Global Policy & Strategy
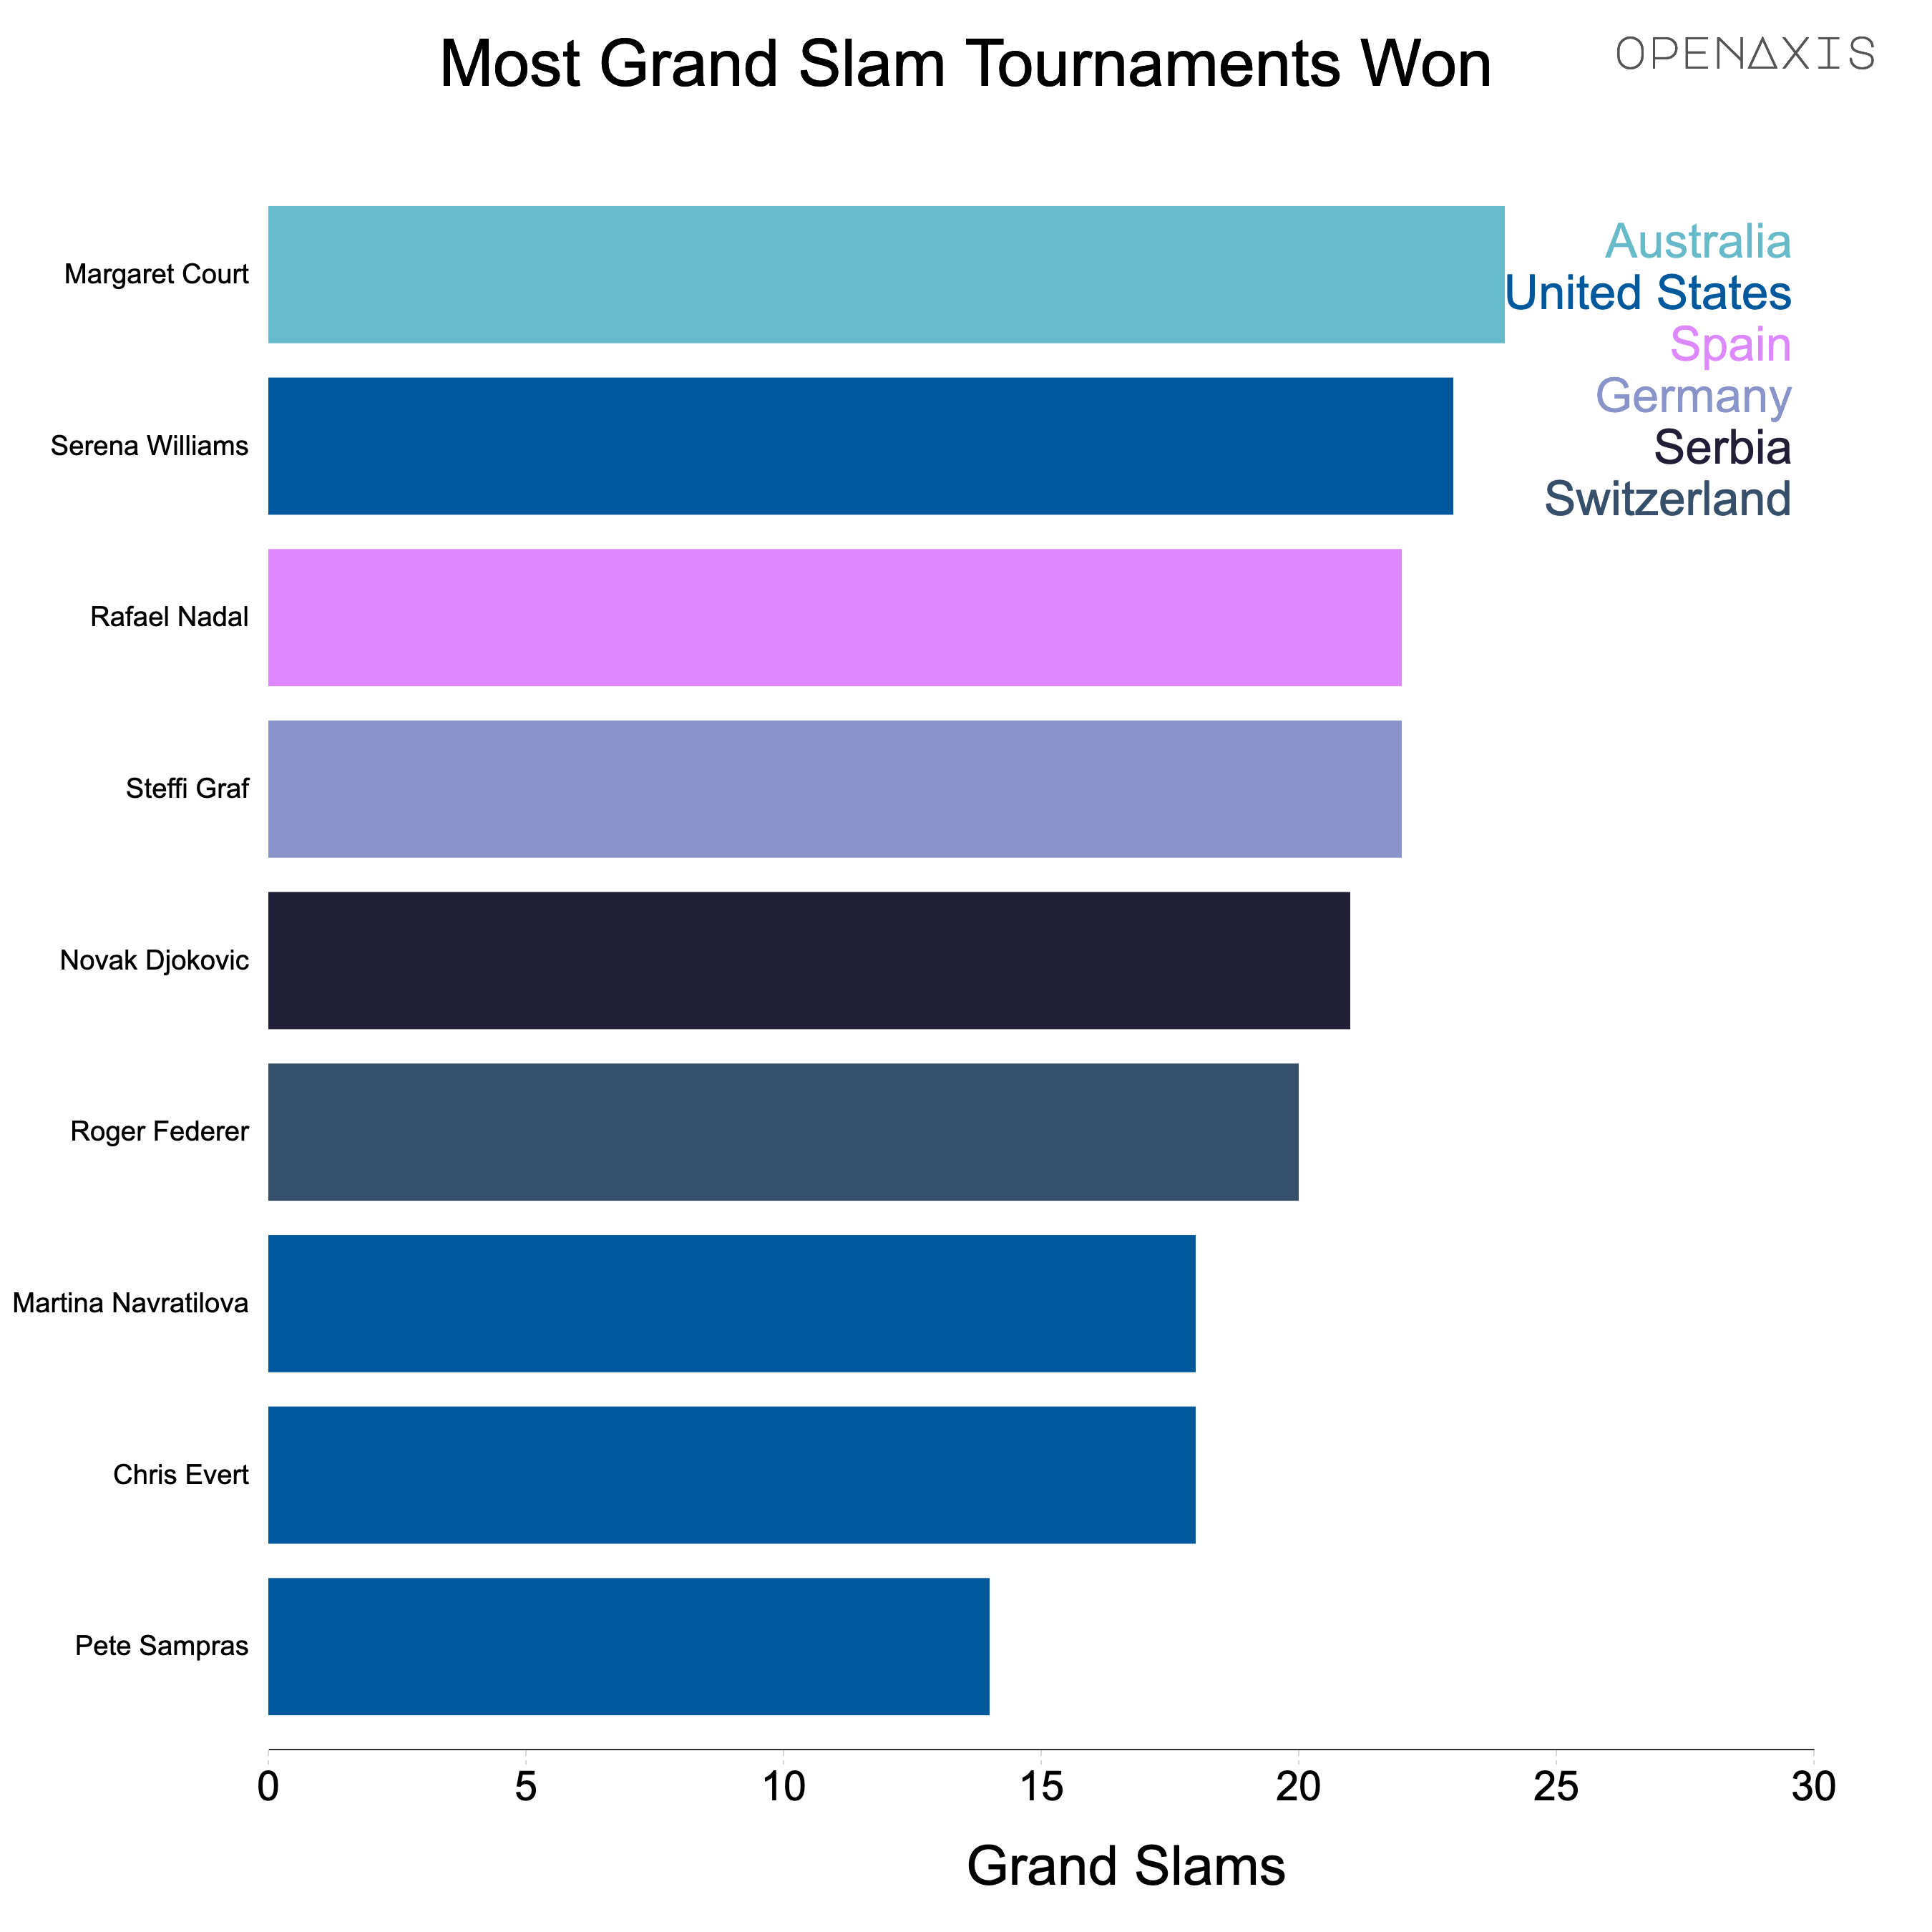
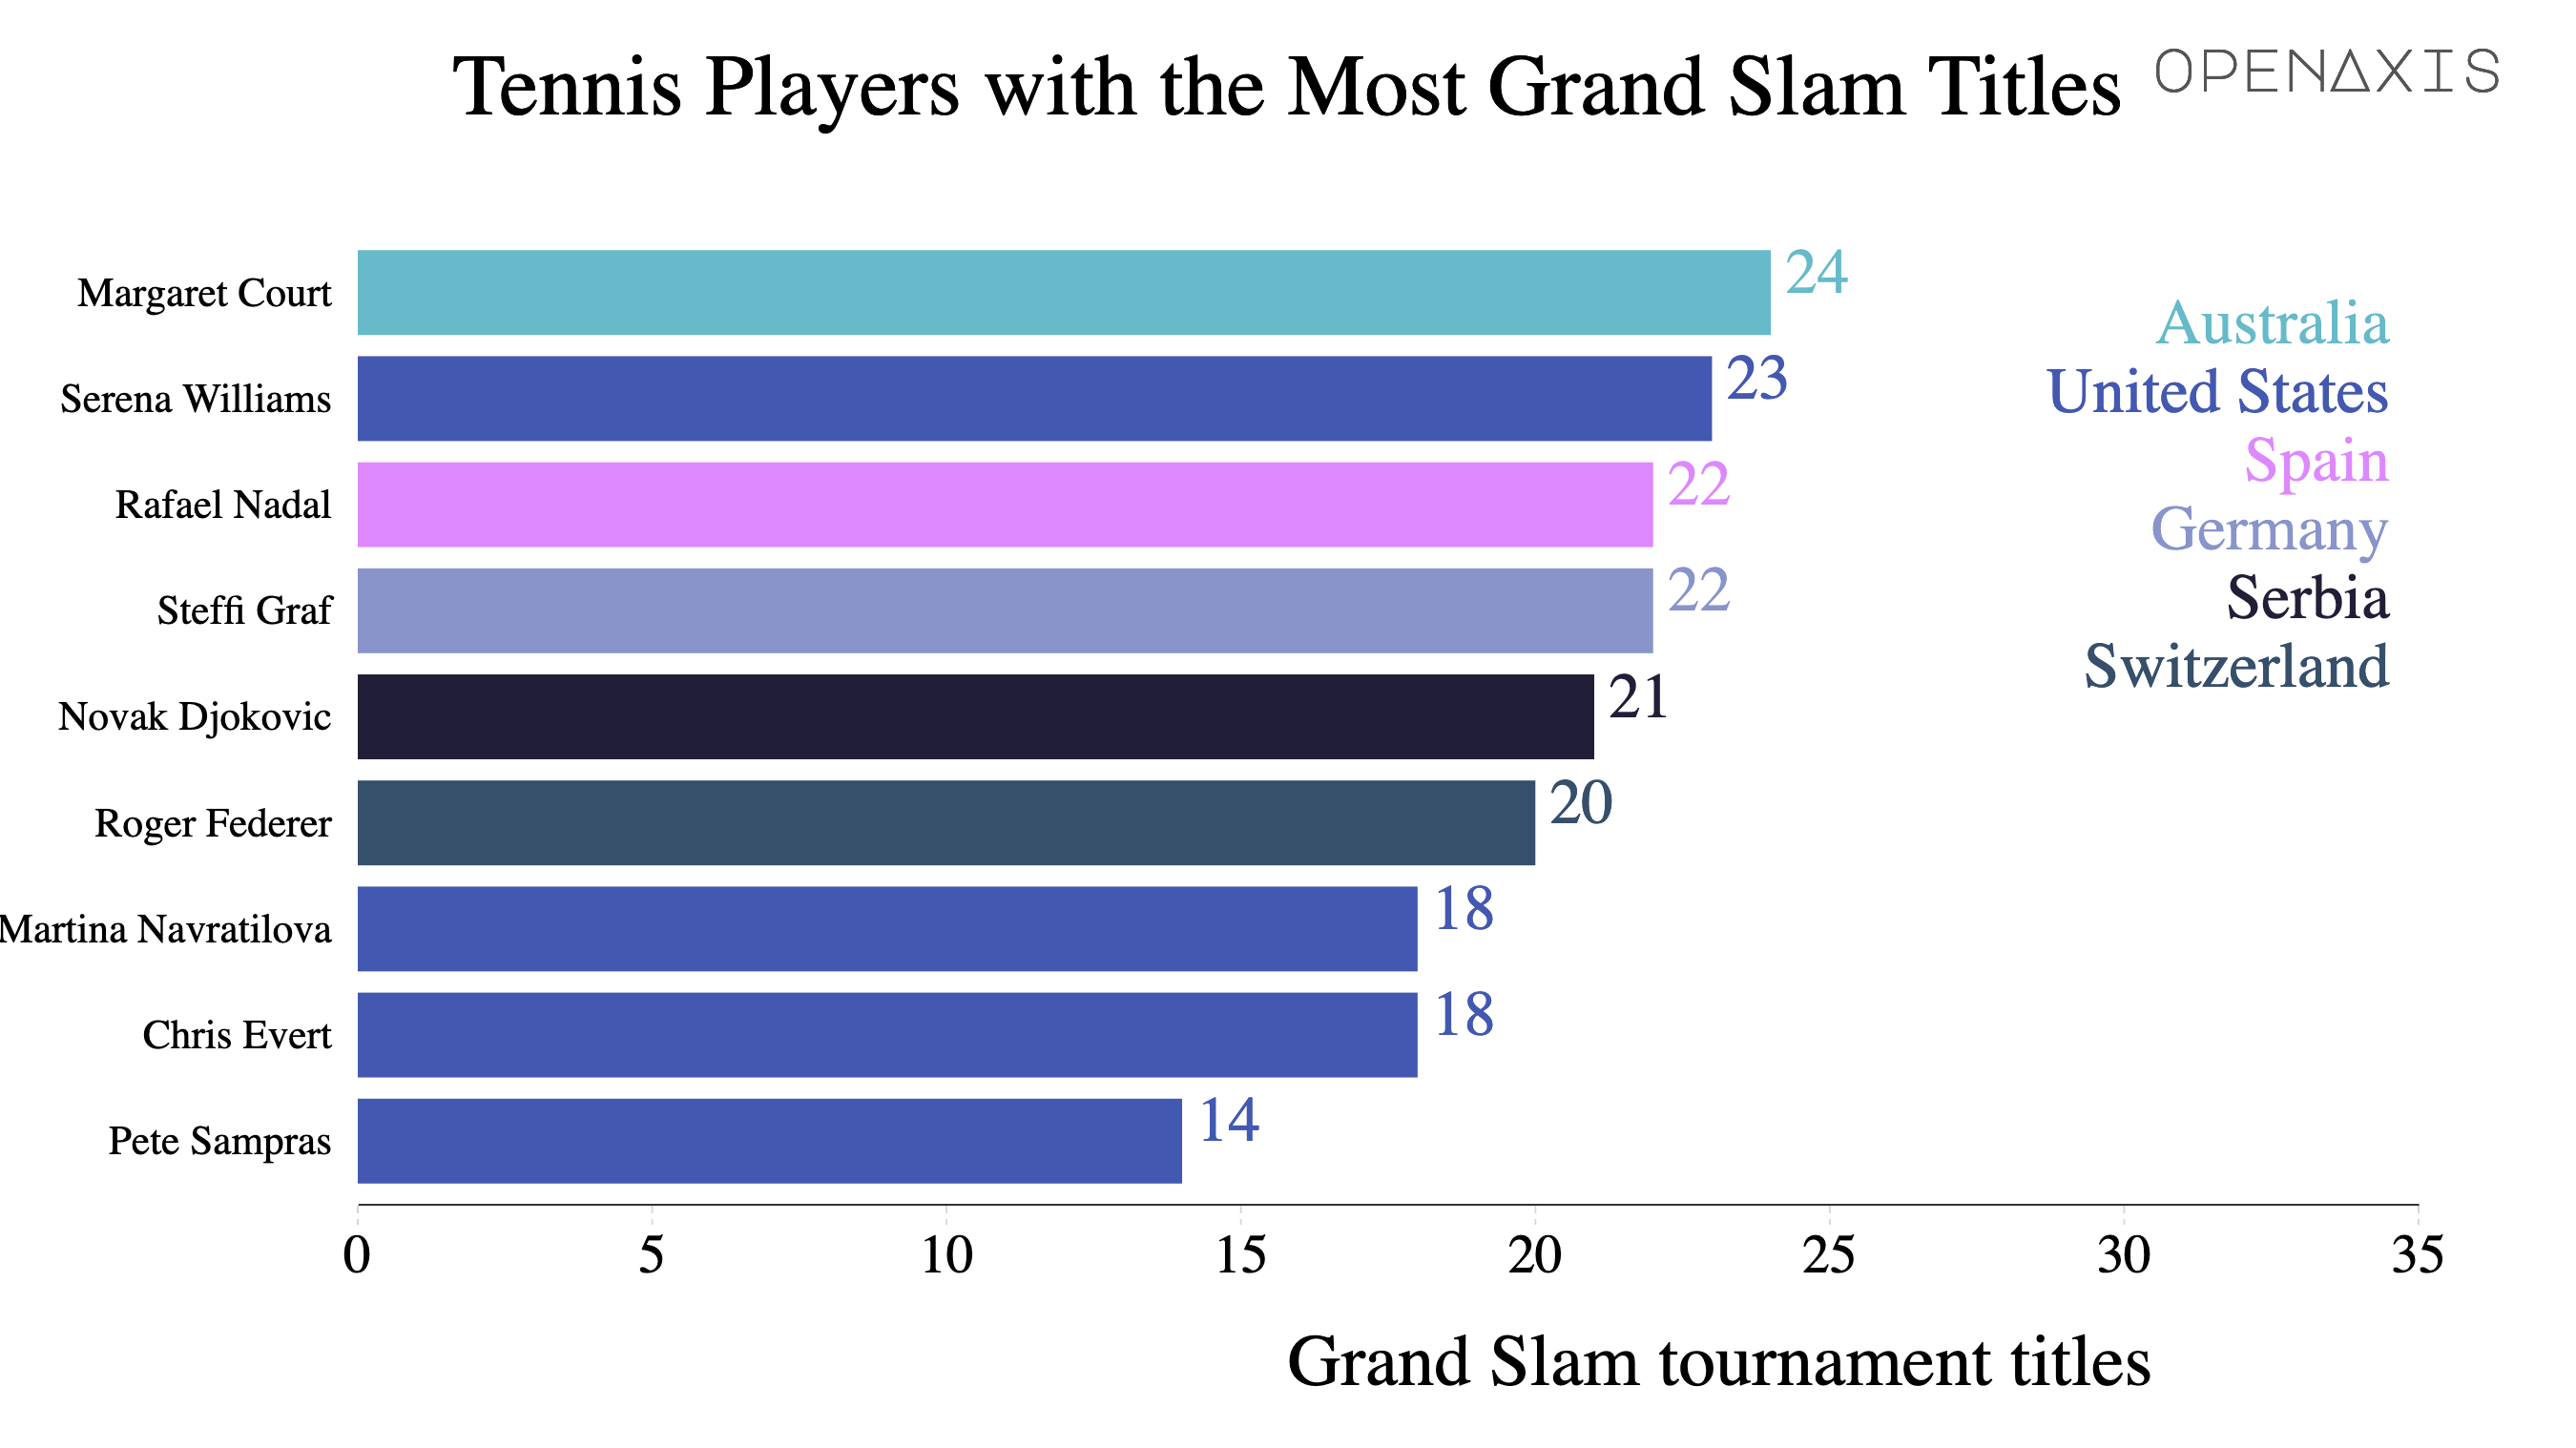
Technically, Margaret Court has the most grand slam titles of all time. However,only 11 titles were received in the “Open Era.” Some people argue this means she did not play against the best players. In addition, her 1966 title was awarded to her by forfeit to an injury from her opponent prior to the match.
Source: Land of Tennis
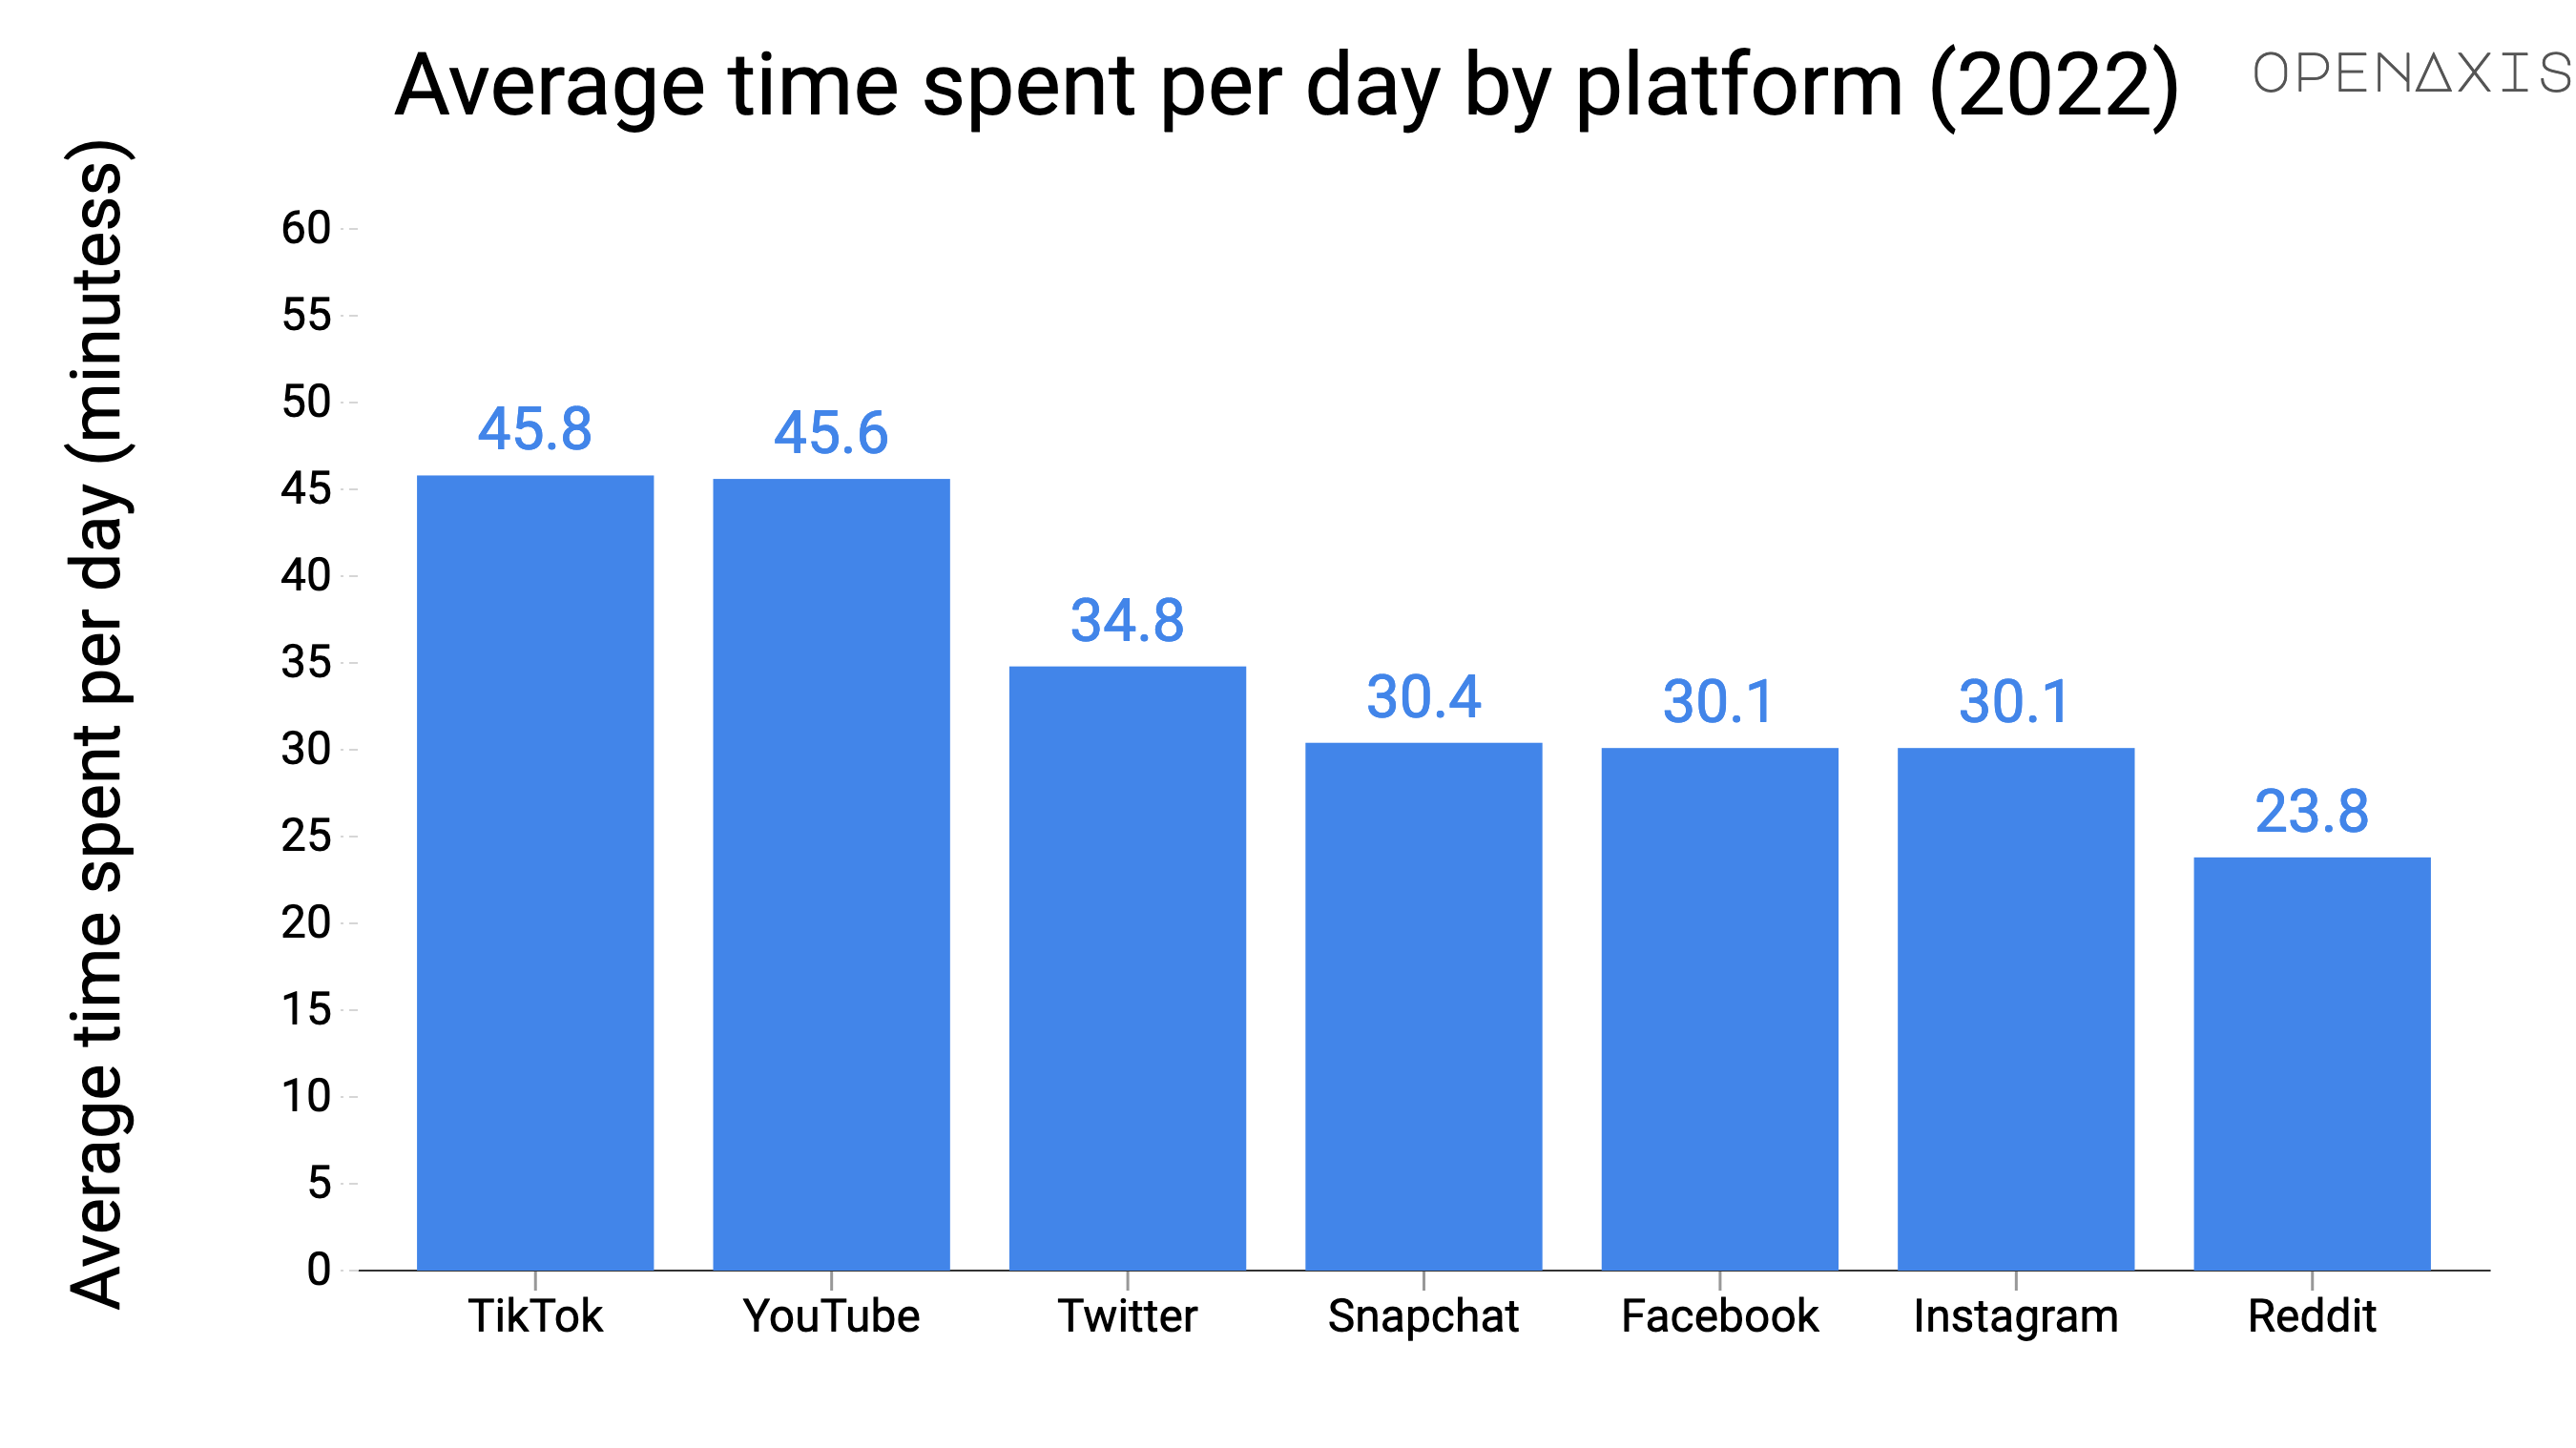
The following data is based on a survey conducted in April 2022. The survey found US adults (18+ yrs) spent more time per day on TikTok than on any other leading social media platform, followed by YouTube and Twitter. Overall, respondents reported spending an average of 45.8 minutes daily on TikTok, 45.6 minutes on Youtube, and 34.8 minutes on Twitter daily.
Source: eMarketer
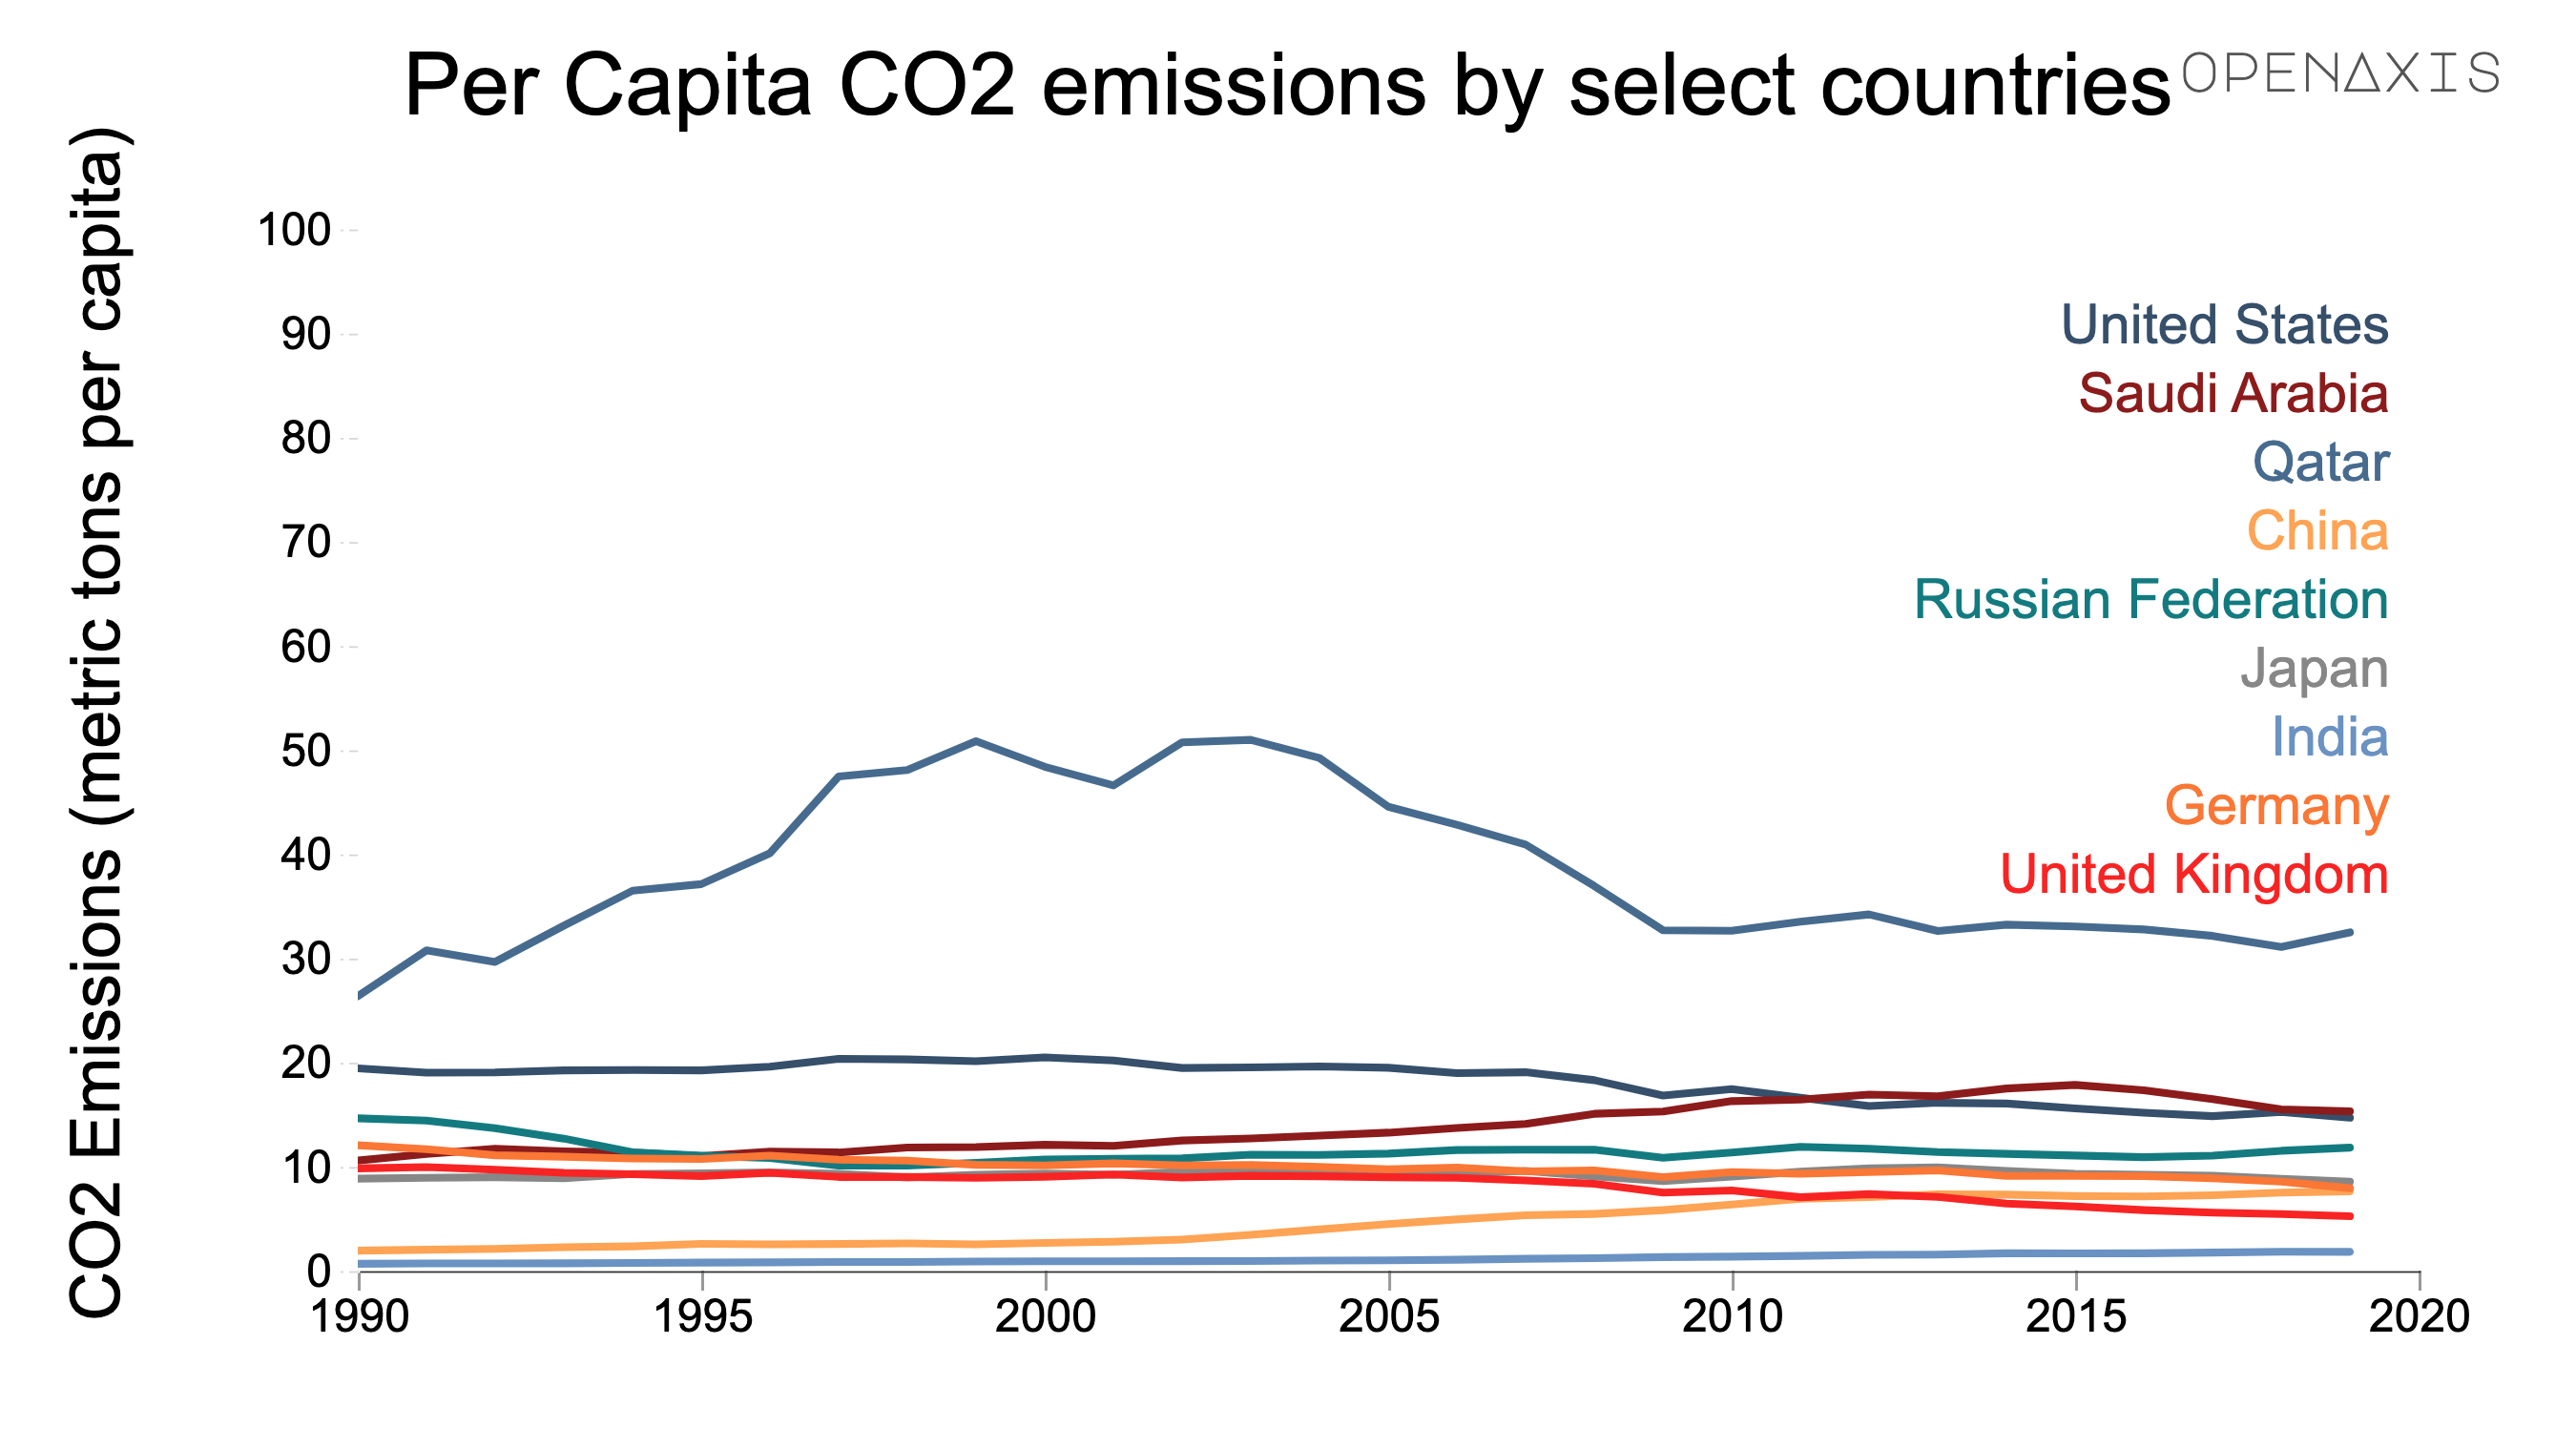
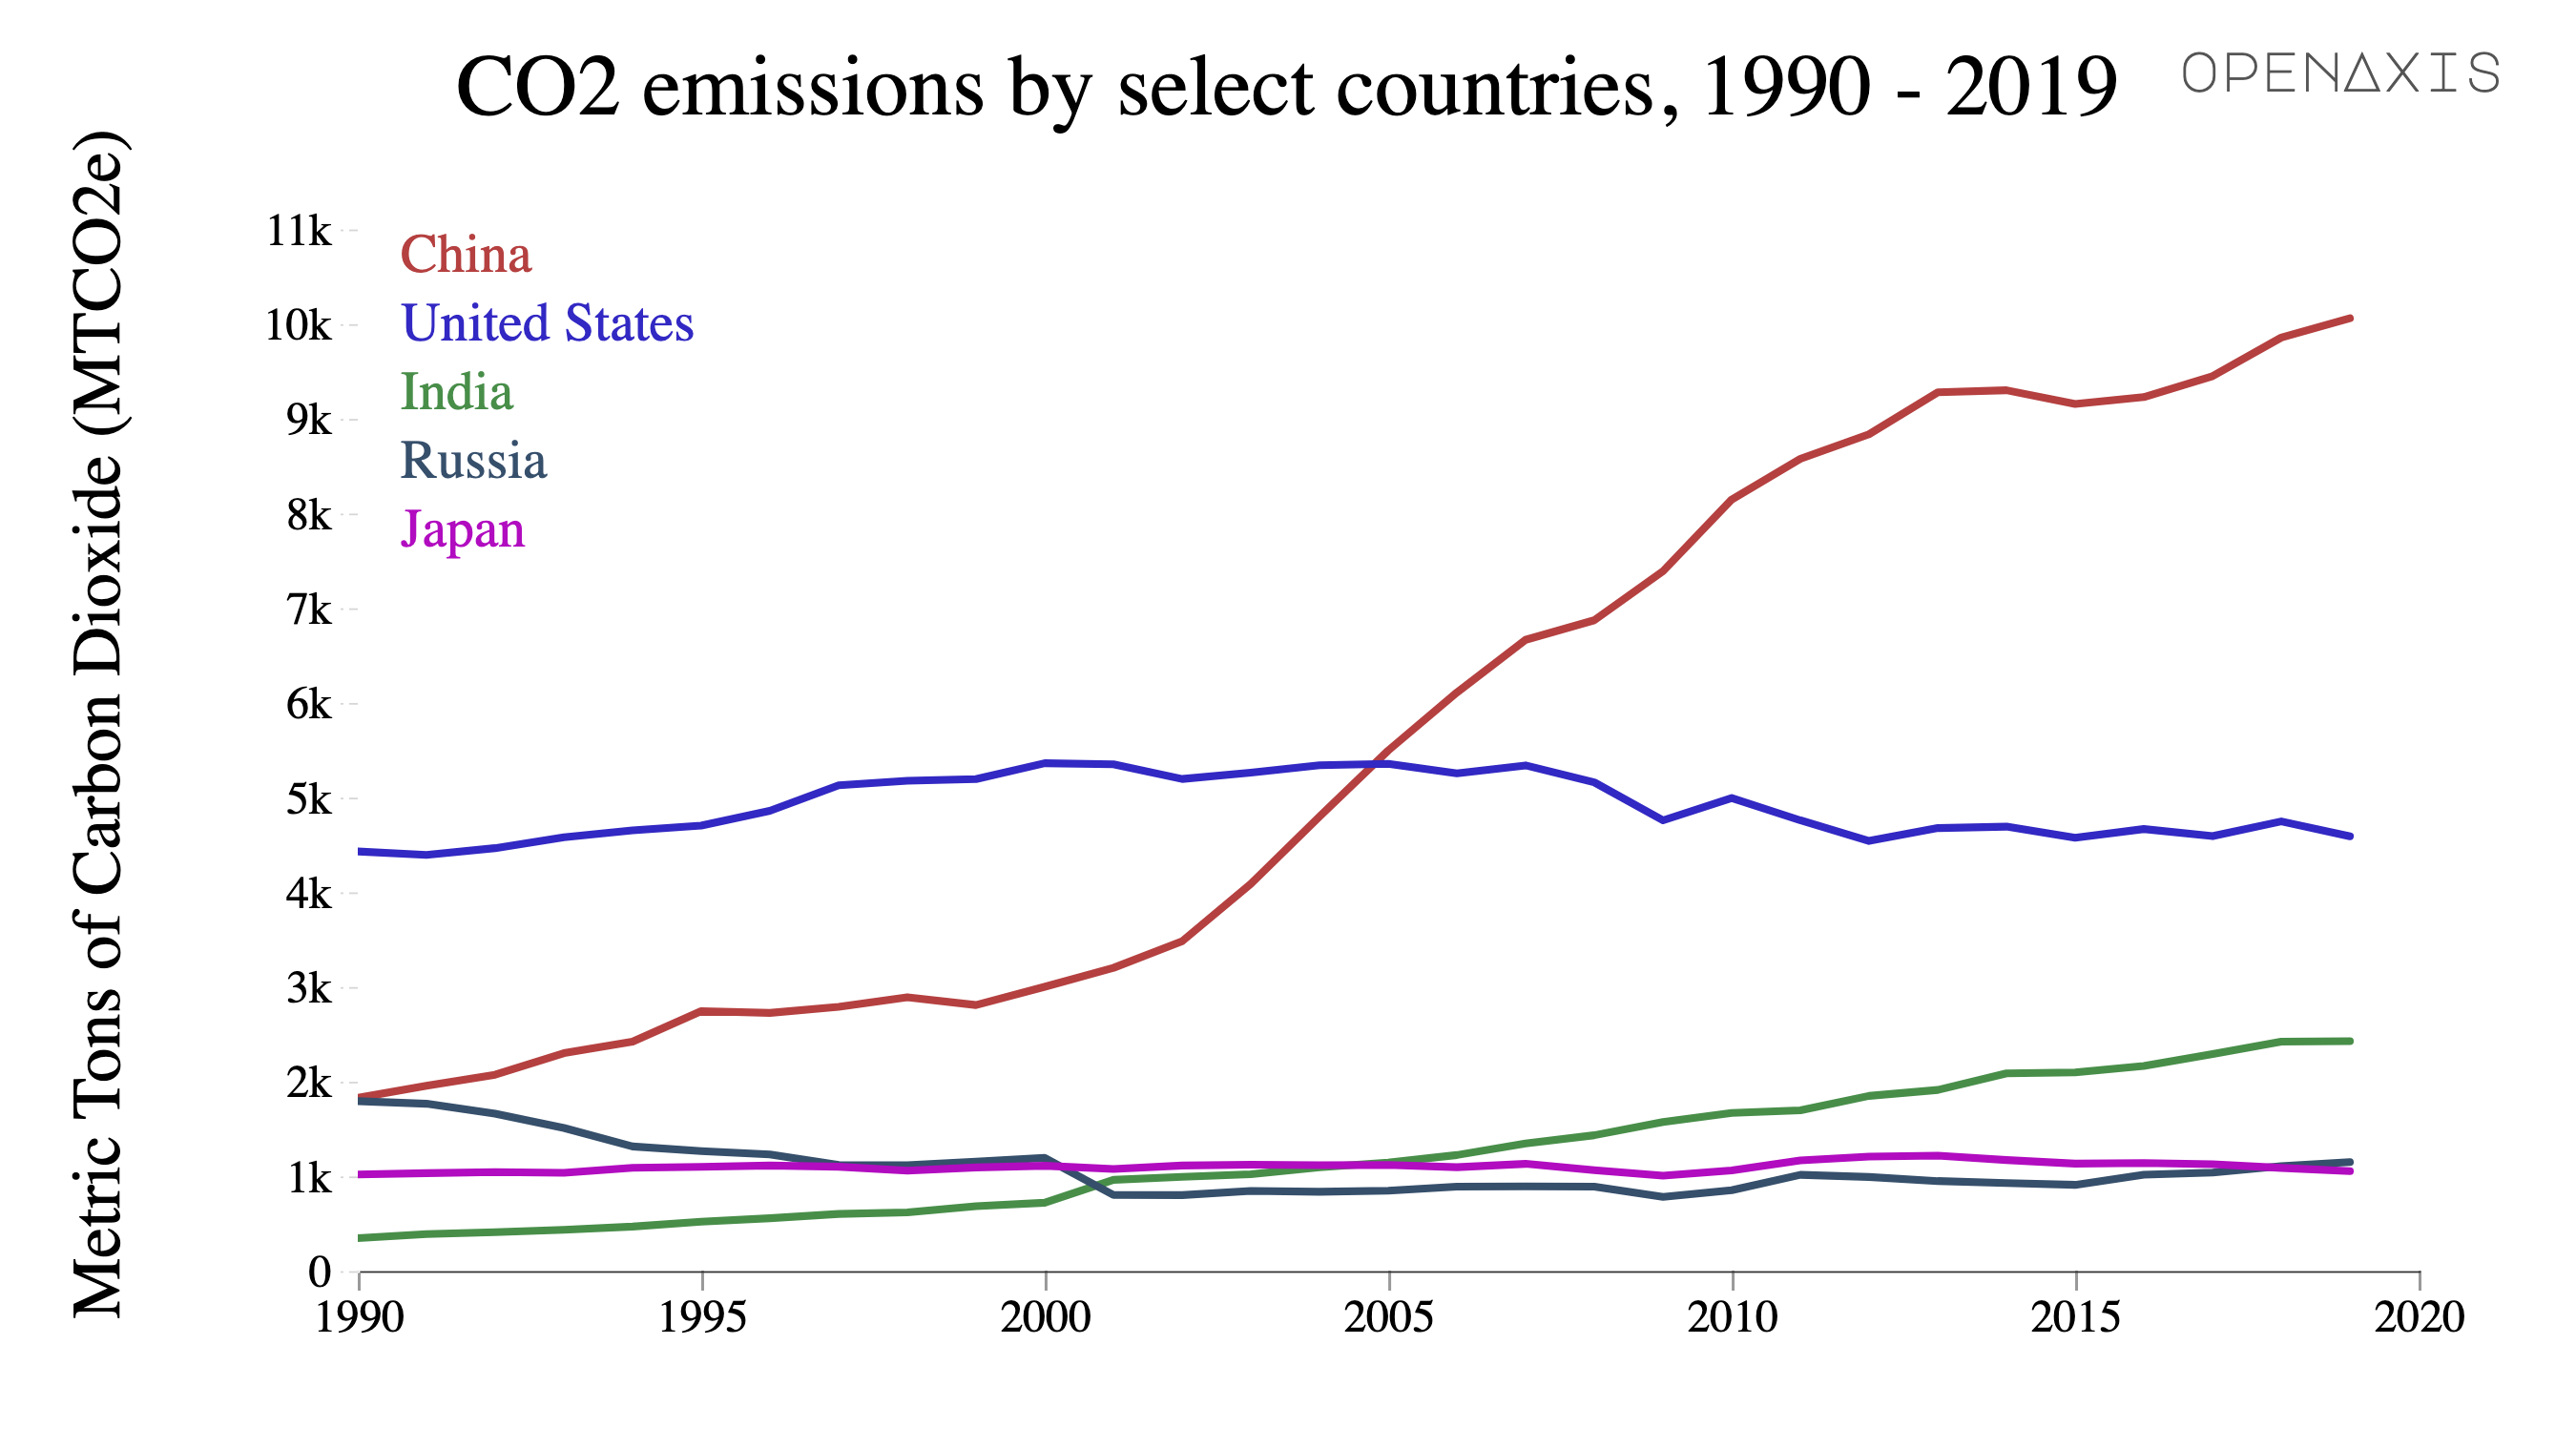
Unit: MtCO2e
China, the United States, India, Japan, and Russia are the top five countries emitting the most carbon dioxide. The top five emitters per capita are Qatar, Kuwait, Saudi Arabia, Canada, and the United States.
However, if you look at the top five countries that have produced the most CO2 from 1975 to 2020, you will find Germany and the U.K. on the list, behind the United States, China, and Russia.
More info here.
Source: Climate Watch
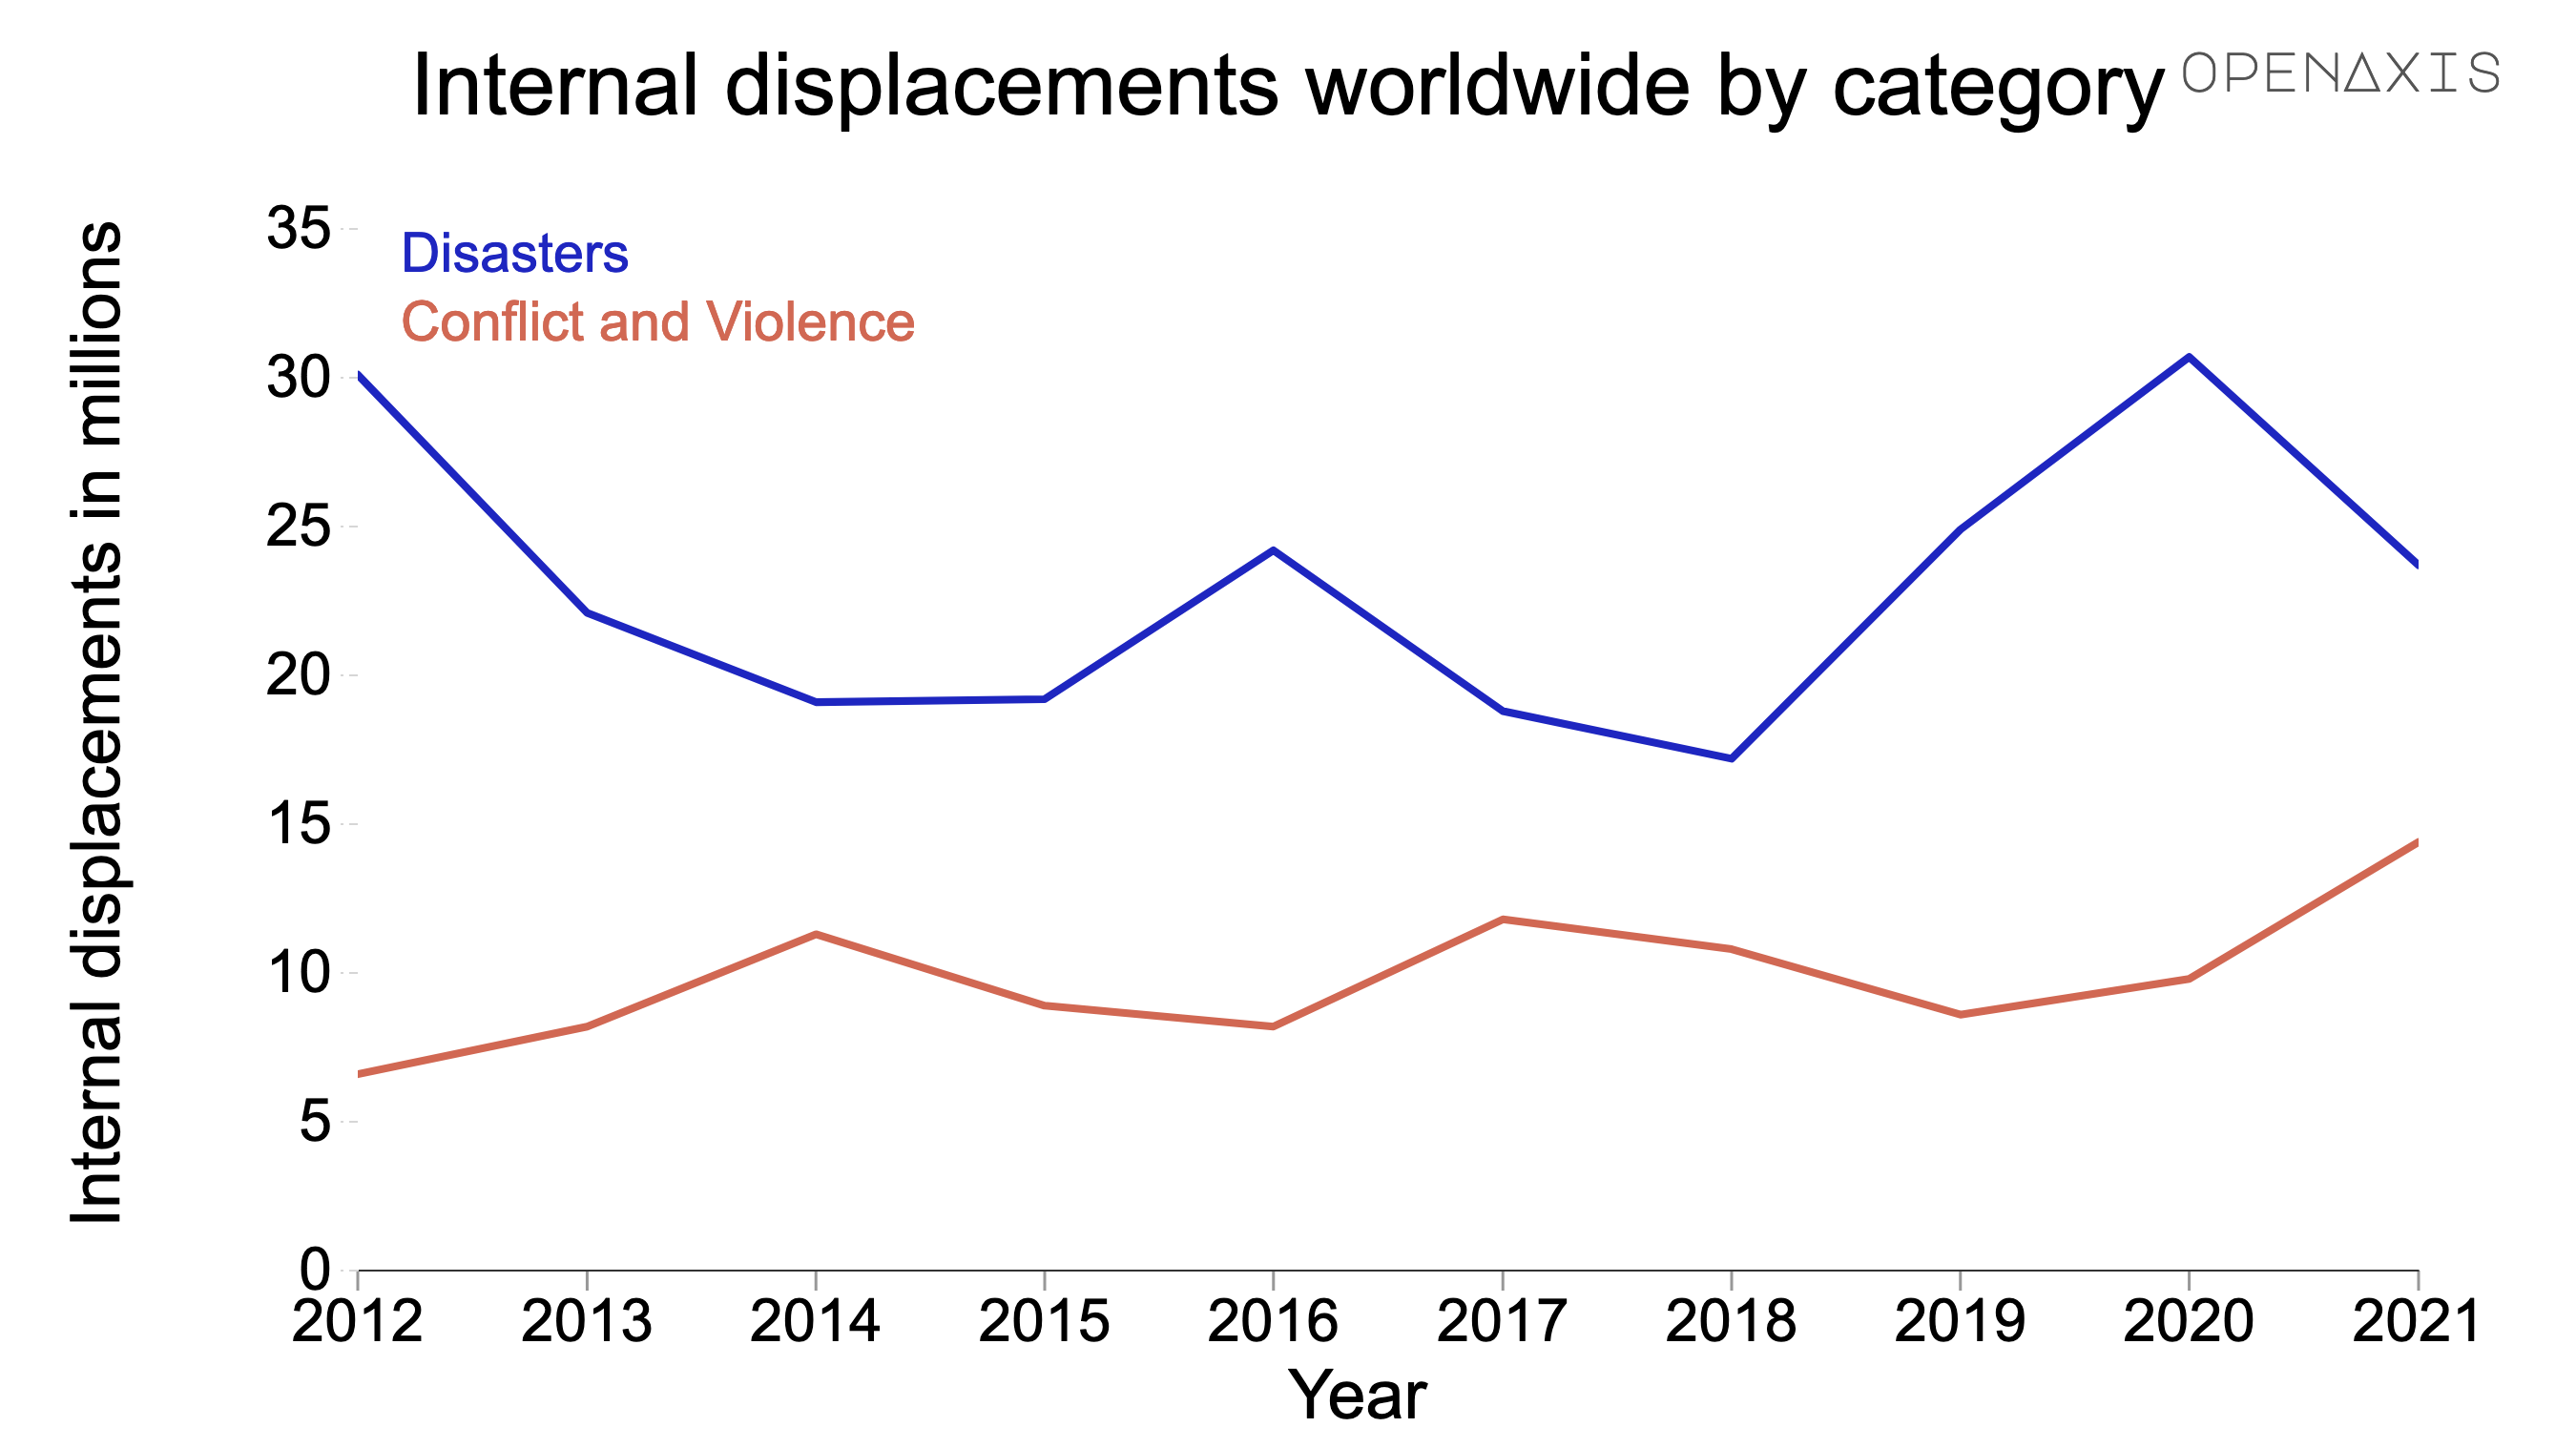
More people are internally displaced worldwide than ever before, a record 59.1 million.
Graph Context:
▪️ The following data is based on the recent report released in May 2022 by the Internal Displacement Monitoring Centre.
▪️Internal displacement refers to the forced movement of people within their country.
▪️ Conflict, violence, and disasters triggered 38 million internal displacements across 141 countries and territories in 2021, the second highest annual figure in a decade after 2020's record-breaking year for disaster displacement.
▪️ Conflict and violence triggered 14.4 million movements, an increase of almost 50 percent from the year before.
More info here.
The following data is based on a survey conducted in April 2022. The survey found US adults (18+ yrs) spent more time per day on TikTok than on any other leading social media platform, followed by YouTube and Twitter. Overall, respondents reported spending an average of 45.8 minutes daily on TikTok, 45.6 minutes on Youtube, and 34.8 minutes on Twitter daily.
More info here.
The following data represents the survey question listed below in regards to COVID-19 safety measures. Recent RAND findings in Walking a Fine Line—Educators' Views on Politicized Topics in Schooling find, "We also asked educators about two specific politicized issues: responding to families’ concerns about (1) the COVID-19 safety measures put in place at their school and (2) teaching about race, racism, or bias. 4 In all cases, more principals than teachers reported these issues as sources of job-related stress. For both teachers and principals, responding to families’ concerns about COVID-19 mitigation measures was a greater stressor than responding to families’ concerns about teaching about race, racism, or bias. However, this response pattern could be related to the timing of the surveys, which were administered in January 2022, when the surge of the omicron variant was at its peak (Smith, Bosman, and Tully, 2022)."
Read the full report here.
Note: These findings are meant to be illustrative of survey findings and not necessarily representative of all teachers.
The following data represents the survey question listed below in regards to teaching topics (race, racism, bias). Recent RAND findings in Walking a Fine Line—Educators' Views on Politicized Topics in Schooling find, "We also asked educators about two specific politicized issues: responding to families’ concerns about (1) the COVID-19 safety measures put in place at their school and (2) teaching about race, racism, or bias. 4 In all cases, more principals than teachers reported these issues as sources of job-related stress. For both teachers and principals, responding to families’ concerns about COVID-19 mitigation measures was a greater stressor than responding to families’ concerns about teaching about race, racism, or bias. However, this response pattern could be related to the timing of the surveys, which were administered in January 2022, when the surge of the omicron variant was at its peak (Smith, Bosman, and Tully, 2022)."
Read the full report here.
Note: These findings are meant to be illustrative of survey findings and not necessarily representative of all teachers.
No Collections Found.

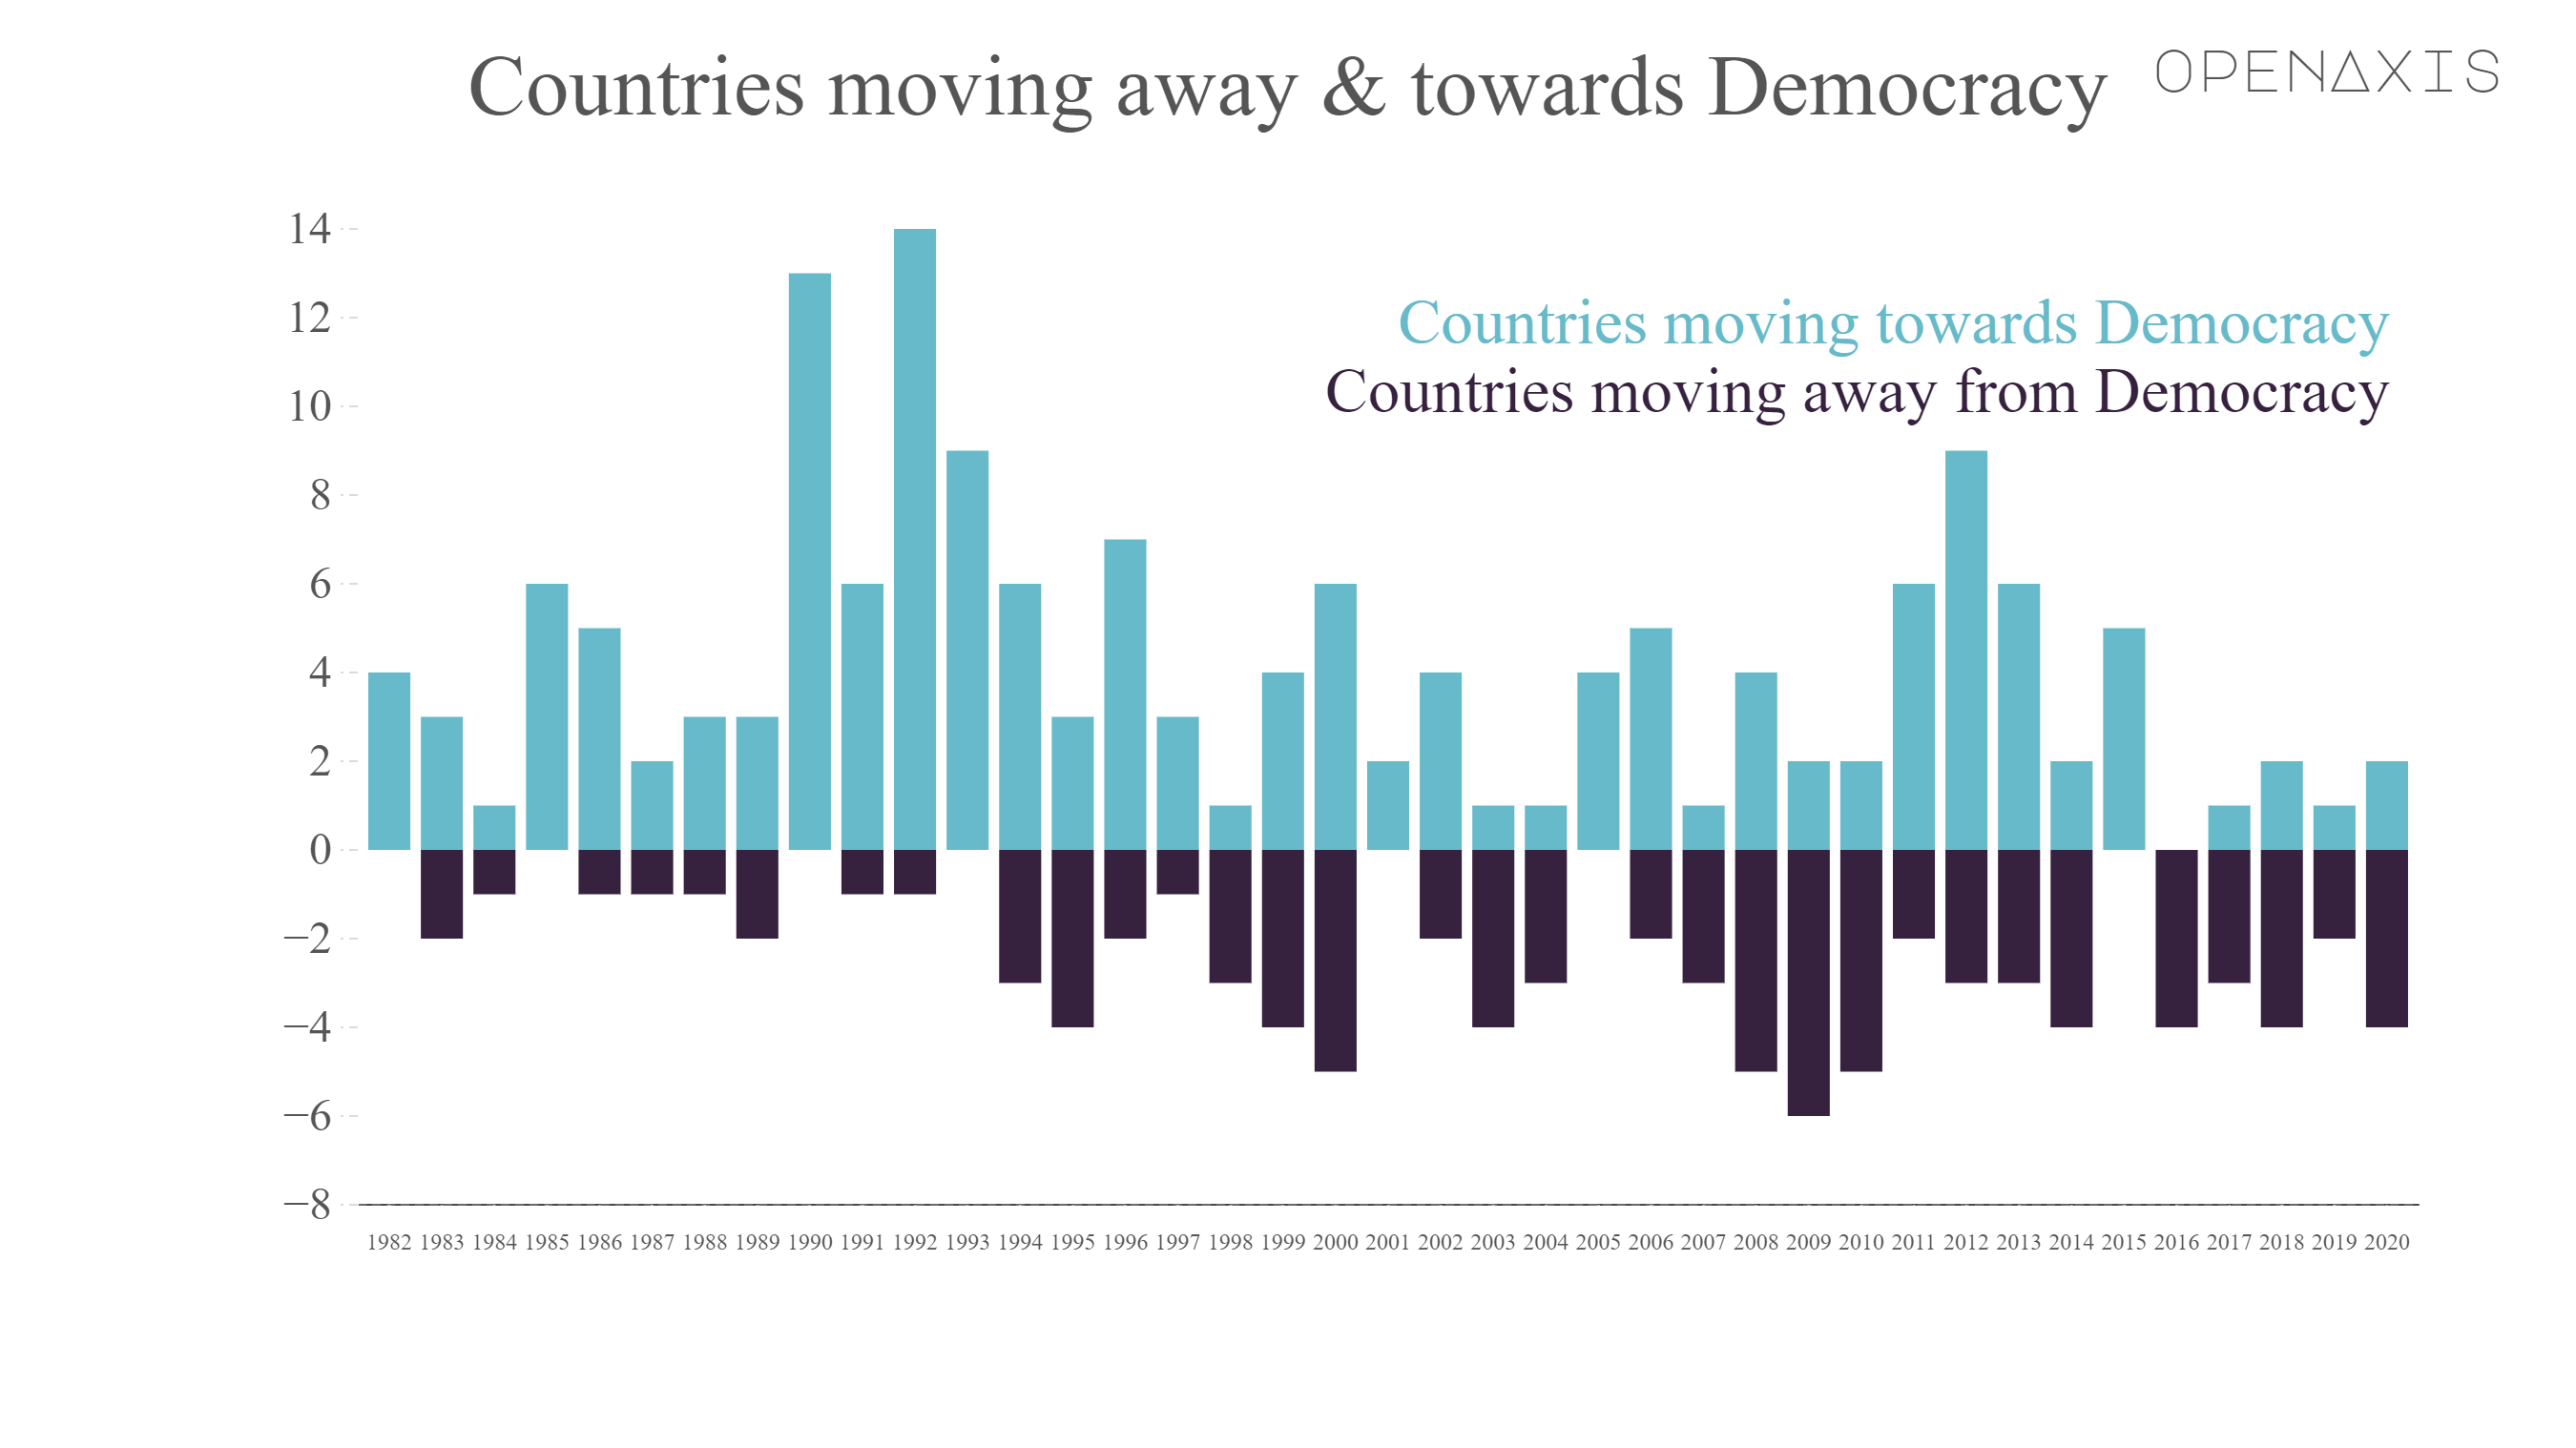
The world is becoming more authoritarian as non-democratic regimes become even more brazen in their repression and many democratic governments suffer from backsliding by adopting their tactics of restricting free speech and weakening the rule of law, exacerbated by what threatens to become a "new normal" of Covid-19 restrictions.
For the fifth consecutive year, the number of countries moving in an authoritarian direction exceeds the number of countries moving in a democratic direction.
In fact, the number moving in the direction of authoritarianism is three times the number moving towards democracy.
Source: International IDEA, The Global State of Democracy Indices, 1975-2020 (2021)


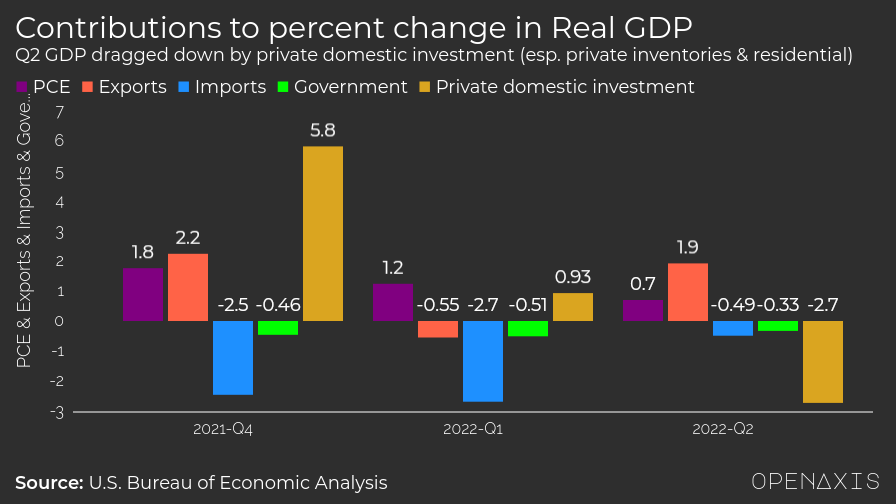
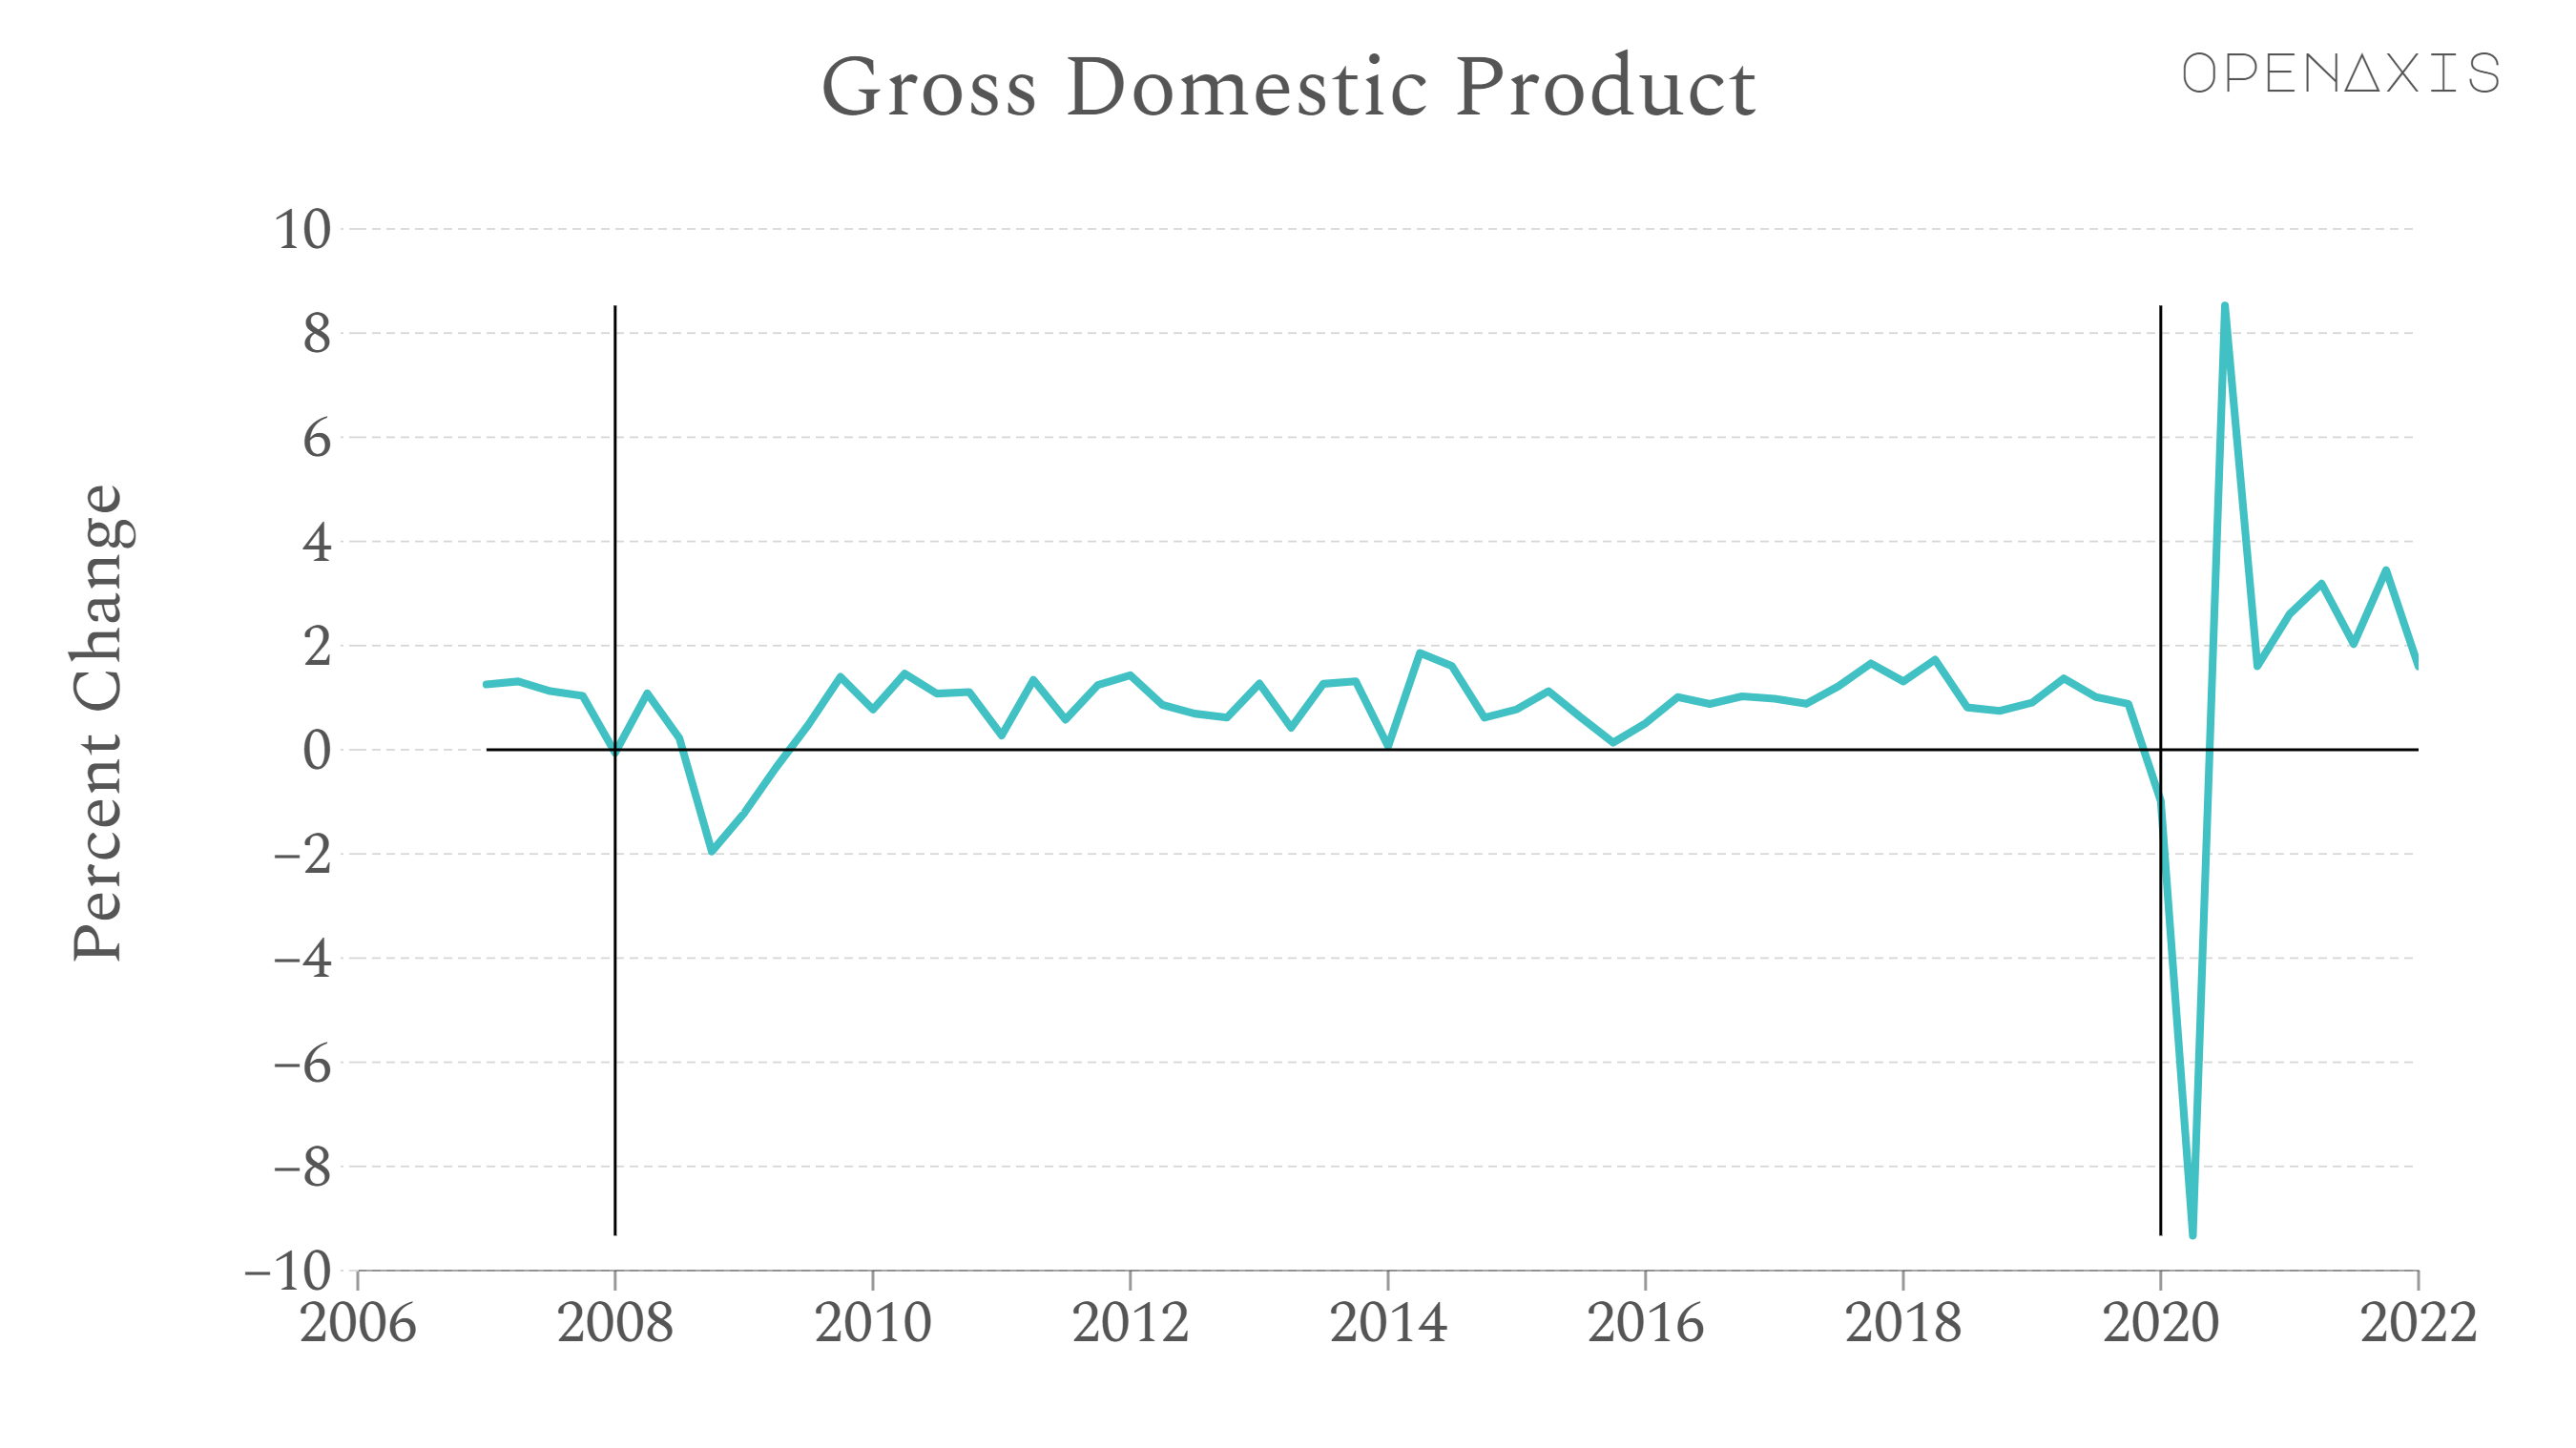
With second-quarter GDP data due out Thursday, the question of whether the economy is in recession will be on everyone’s mind.
The economy stands at least a fair a chance of hitting the rule-of-thumb recession definition of two consecutive quarters with negative GDP readings.
The last two recessions were in 2020 and 2008-2009, as annotated in the chart above.
Should inflation stay at high levels, that then will trigger the biggest recession catalyst of all, namely Federal Reserve interest rate hikes.
Treasury Secretary Janet Yellen said “we just don’t have” conditions consistent with a recession.
#economy #recession #inflation
Source: U.S. Bureau of Economic Analysis

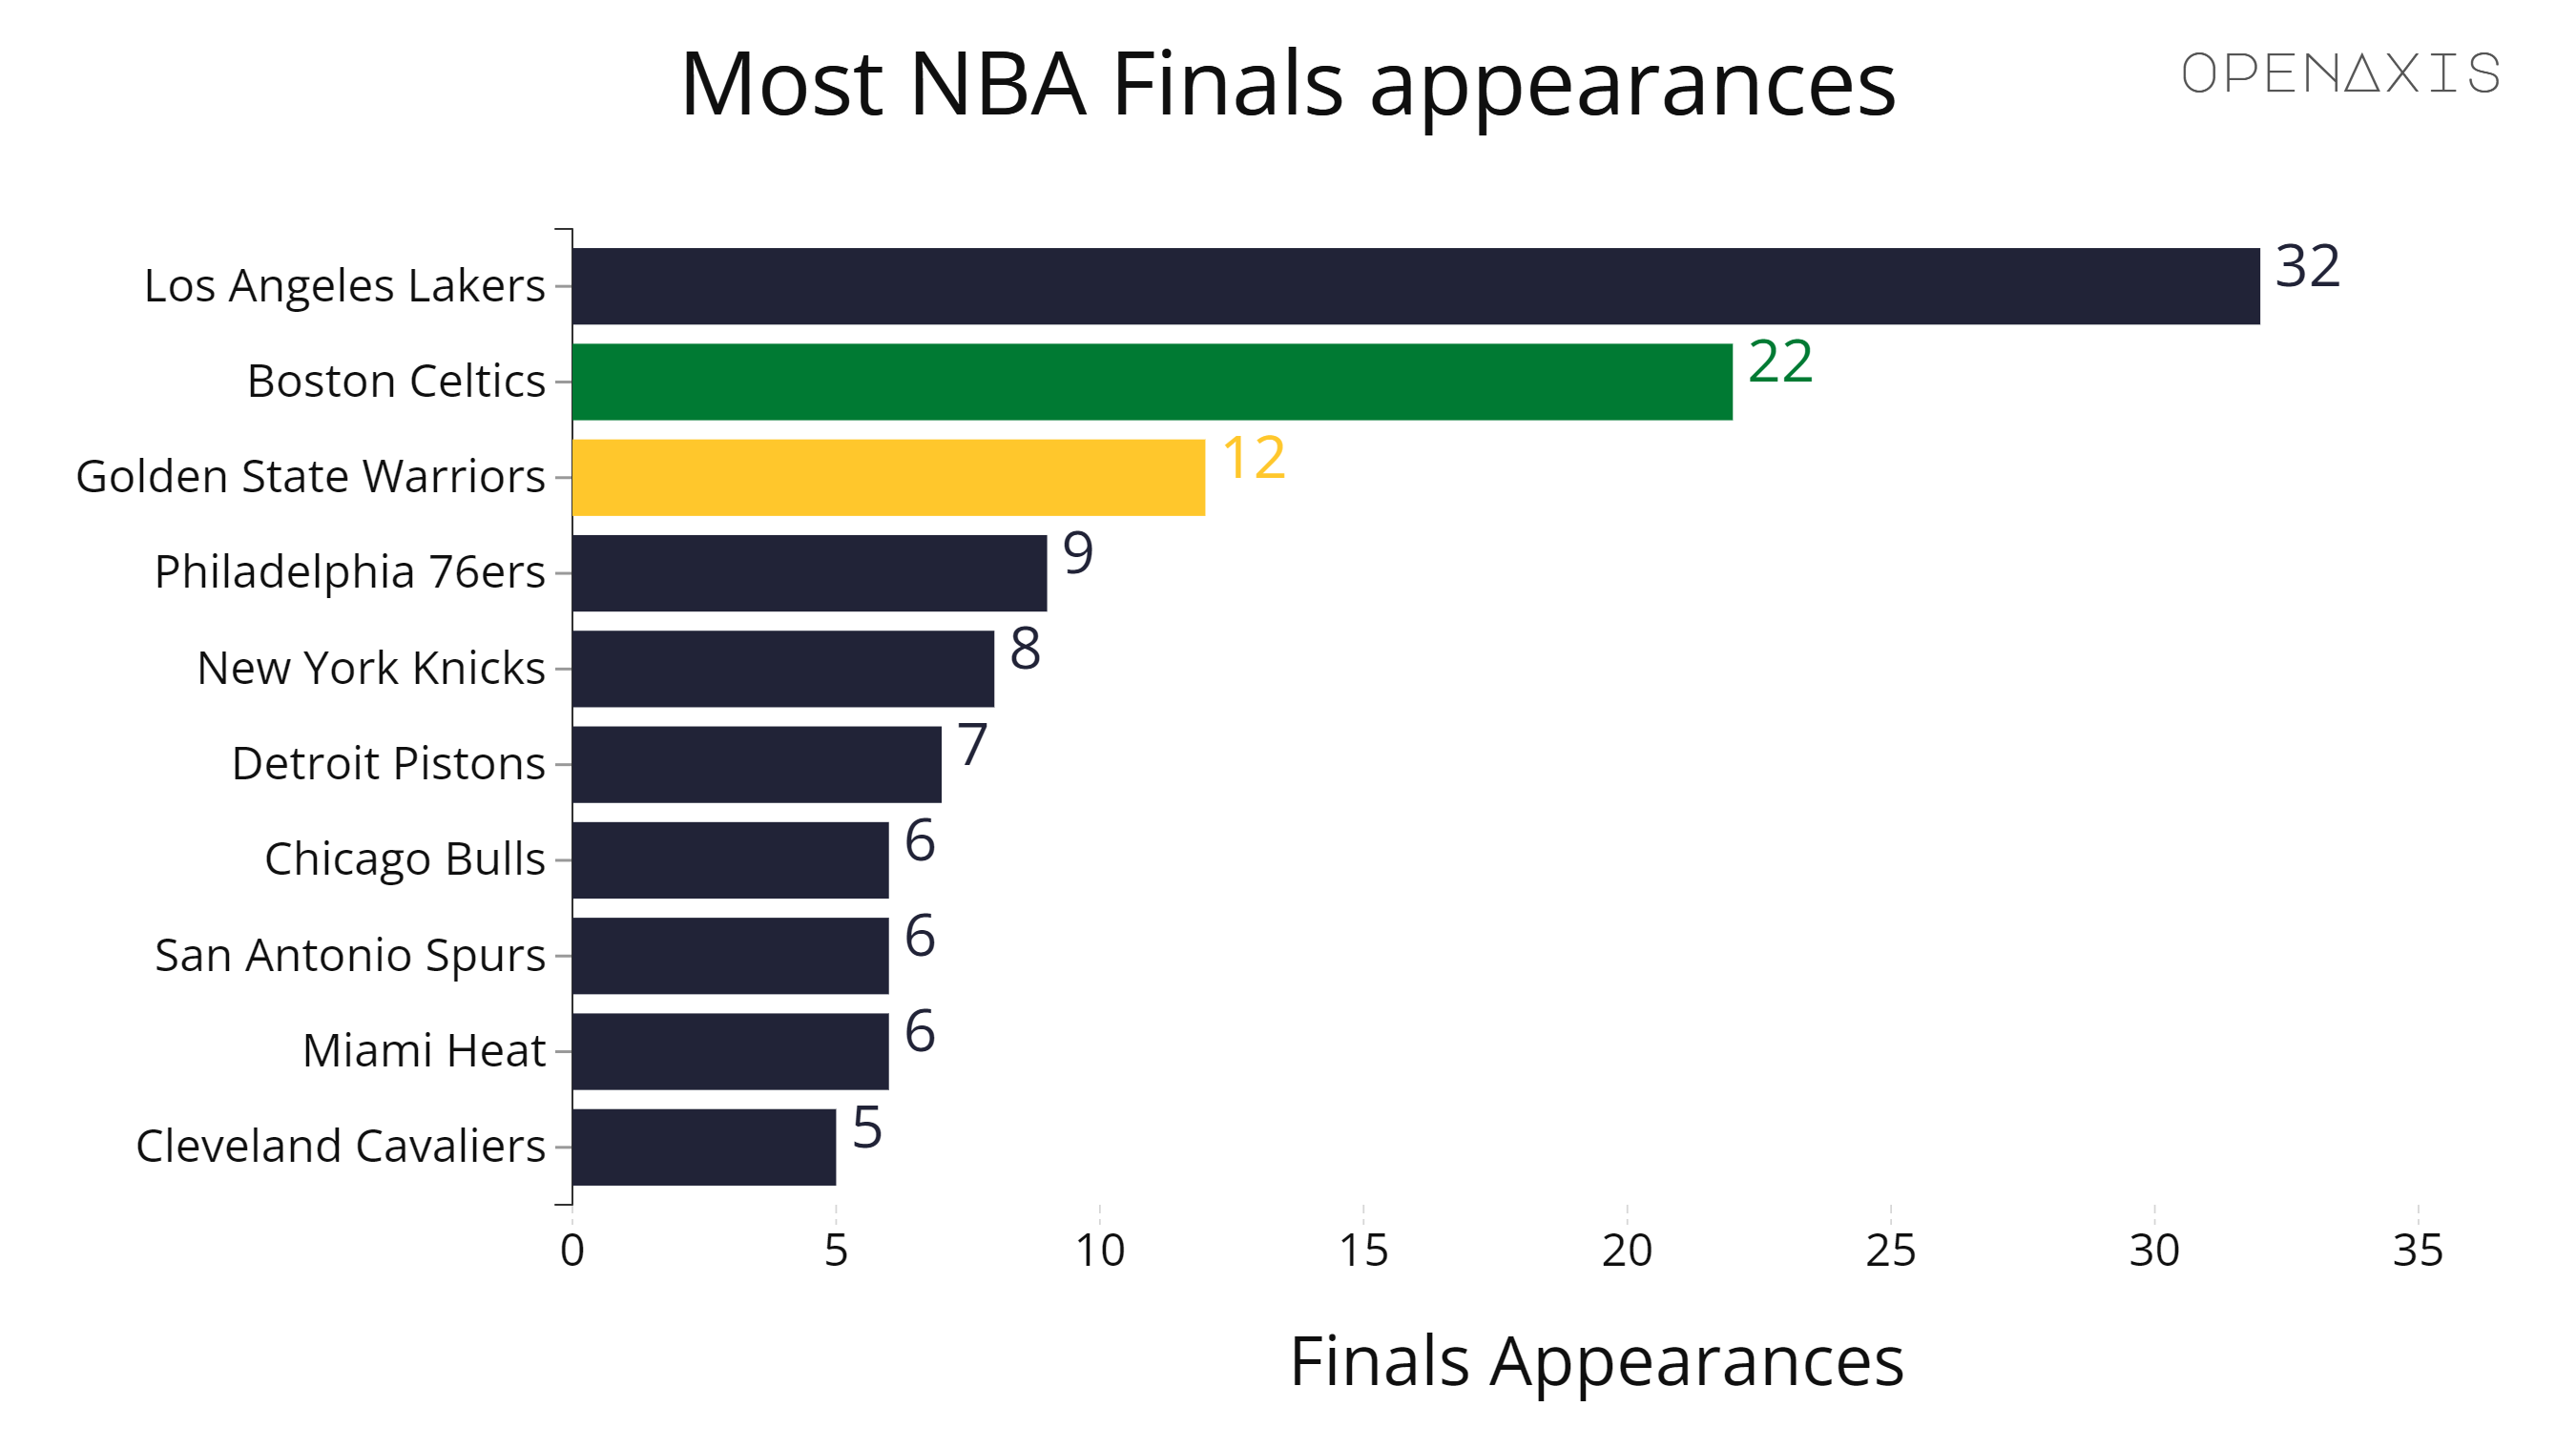
The Los Angeles Lakers have competed in the NBA Finals the most times, with 32 appearances. The Eastern Conference has provided the most champions, with 38 wins from 10 franchises; the Western Conference has 34, from nine franchises.
#sports #basketball
Source: Statmuse, NBA

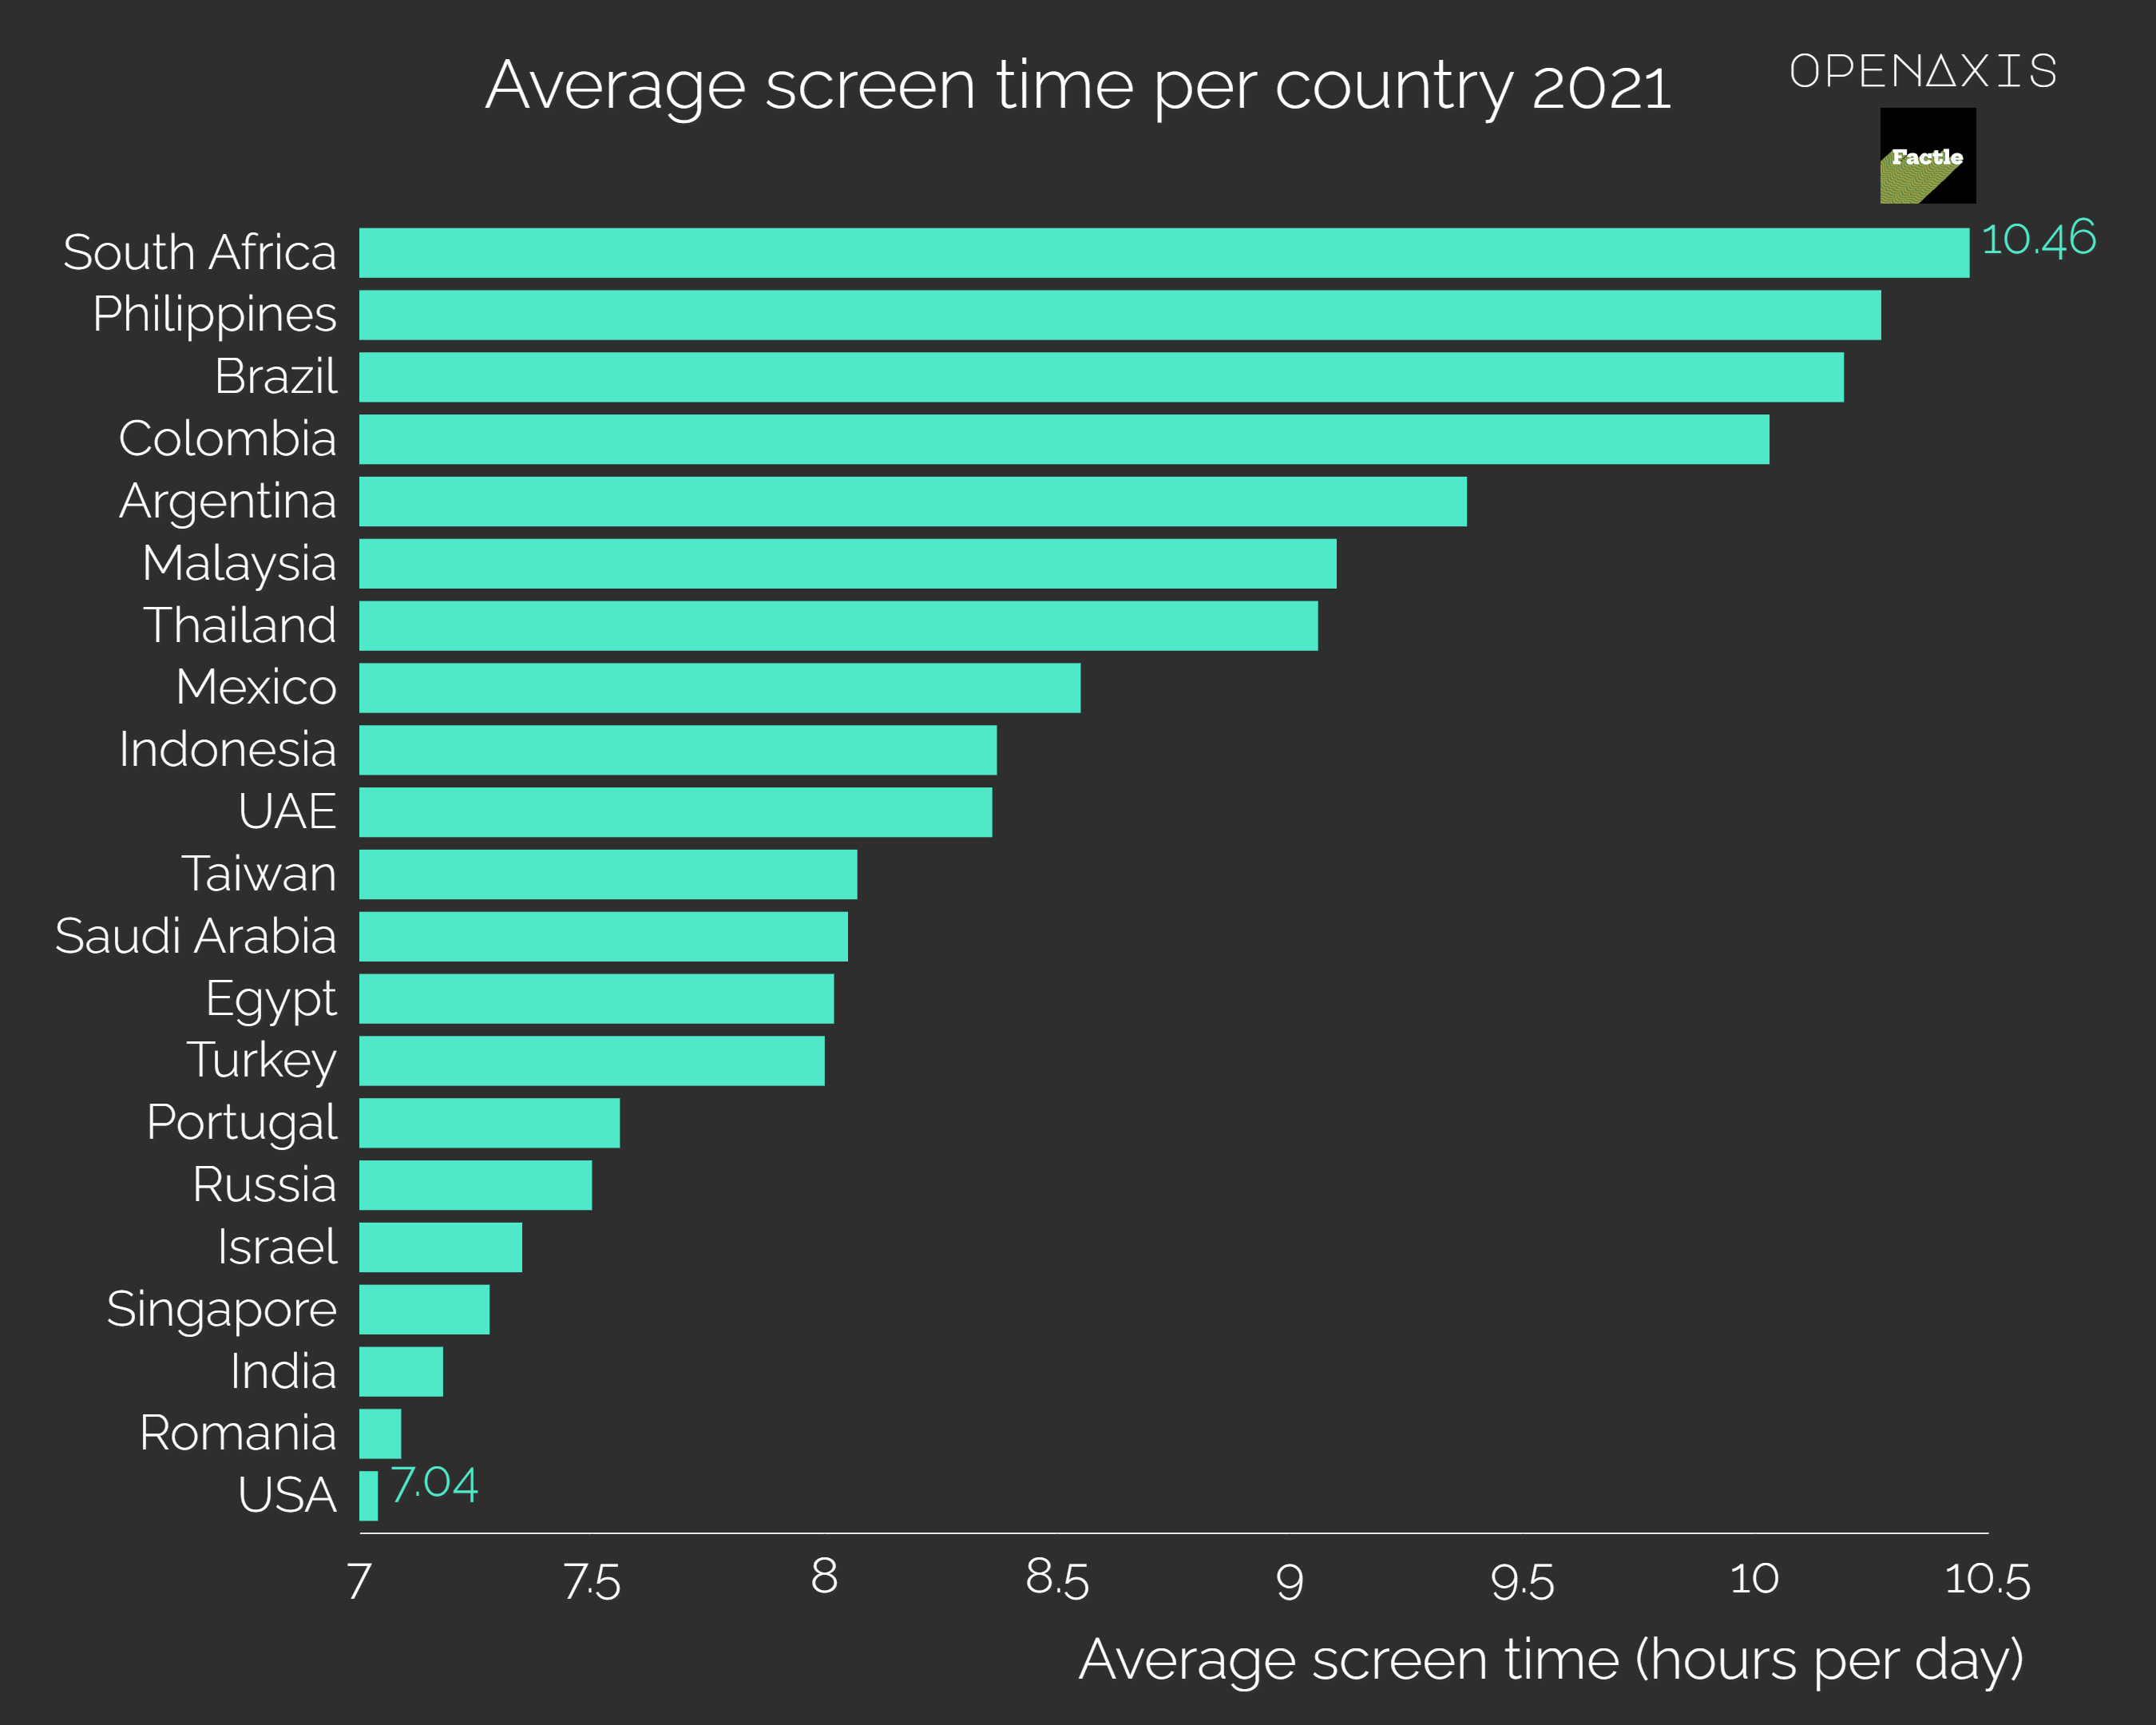
Worldwide, the average person spends a total of 6 hours and 57 minutes looking at a screen each day (for internet-connected activities).
The average American spends 7 hours and 4 minutes looking at a screen every day. This is slightly below the worldwide average and around 45 minutes longer than the British who average 6 hours and 12 minutes of screen time per day.
But it is nearly four hours less than the biggest screen-time consumers, South Africans, who average around 10 hours and 46 minutes a day.
On the whole, the biggest screen-time consumers are located in Africa, Asia, and South America.
#screentime #internet
Source: DataReportal