
2000 characters left
A full description can be found in
Krause, P. R., Fleming, T. R., Peto, R., Longini, I. M., Figueroa, J. P., Sterne, J. A., ... & Henao-Restrepo, A. M. (2021). Considerations in boosting COVID-19 vaccine immune responses. The Lancet, 398(10308), 1377-1380.
at https://www.thelancet.com/journals/lancet/article/PIIS0140-6736(21)02046-8/fulltext#%20
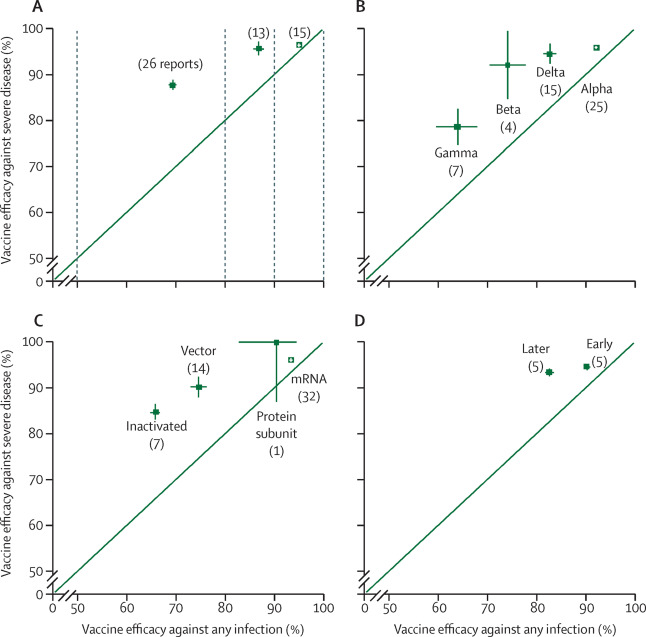
Each quadrant is looking at vaccine efficacy against severe disease or death on the Y axis and any infection on the X axis.
It said 1 comment instead of 0.
Maybe the count should include the top level thread/comment? (so it's 1 if no responses, 2 if there is a response?)
where does it show the number of comments? i only see # of up or down votes
No Data Sources Found
we should have a mechanism that doesn't allow you to post a chart unless it is accompanied by a dataset!
There's 4 graphs, but I'll focus on one for simplicity.
Take the bottom right graph
- the Y axis is the effectiveness of vaccines against severe disease
- the X axis is the effectiveness of vaccines against ANY infection (severe or mild or asymptomatic)
- while the effectiveness of vaccines against any infection drops LATER (i.e., a long time after vaccination) relative to EARLY (i.e., soon after vaccination), the change in effectiveness against severe disease is minor.
- this indicates that while the effectiveness of vaccines against any infection does wane over time, the effectiveness against severe disease remains strong
I have several accounts. I can give you 5 likes =) But the quick summary?
I am about to do a Black Friday subscription to competitor product (for a 3-year subscription), but wanted to see if it was quick and easy to get insights here and see what the community was like. No problem if the quick summary is not on the table.
Ahhh (Note) your summary didn't show up as I was writing out my reply ( my reply no longer makes sense contextually in the time frame.). I can't edit or delete my old comment.
I just read your reply. It was only 1 graph summarized out of 4, so I will have to edit my above compliment to say, you are a (1/4) gentleman and a (1/4) scholar. Good day to you sir.
Also, it was not summarized simply enough -- that was "explain it to me like I am 12", I need a "explain it to me like I'm 5". (No offense to 5-year olds current or future.)